Cost Benefit Analysis
Cost Benefit Analysis. Do Speed Cameras Produce Net Benefits? Evidence from British Columbia, Canada . My name and the Citation of the cost benefit analysis. My Name: Sarah Abdulkarim. Title: Do Speed Cameras Produce Net Benefits? Evidence from British Columbia, Canada

Cost Benefit Analysis
E N D
Presentation Transcript
Cost Benefit Analysis Do Speed Cameras Produce Net Benefits? Evidence from British Columbia, Canada
My name and the Citation of the cost benefit analysis • My Name: Sarah Abdulkarim. • Title: Do Speed Cameras Produce Net Benefits? Evidence from British Columbia, Canada • Source: Journal of Policy Analysis and Management v25, n3 (Summer 2006): 661-78 • Document Type: Journal Article • Database: Econ-Lit
Introduction: • Worldwide, road traffic injuries are the leading cause of death by injury and the ninth leading cause of all deaths. • Traffic collisions kill about 43,000 Americans a year
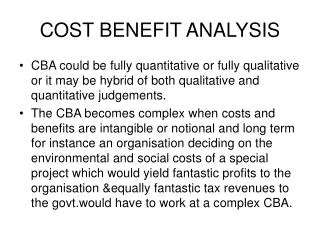
Primary questions need to be addressed • What are the Costs of the speed cameras? • What are the Benefits of the speed cameras? • Do speed cameras produce Net Benefits?
Method used to analyze the questions • The study introduced all the cost and benefits of the speeding cameras on: • The societal point of view • Sponsoring-agency perspectives: Insurance Corporation of British Columbia (ICBC)
Data source used in the article • The analysis that is used in this study is based on two years of program data (1996 through 1998)
Total Program Costs • Tables 2 & 3: Both the societal and ICBC perspectives, Photo Radar Program costs were = C$27.3 million. • Cost of travel time = C$372 million per year
Benefit from Reduction in Collisions, Injuries, Deaths, and Property Damage • it was estimated that the program prevented: • 2,220 fewer injury collisions (14%) • 79 fewer fatal collisions (26%) • Emergency response worth C$0.14 million was avoided by photo radar
In the societal perspective… • lives and injuries were valued using estimated economic values of: -C$120,000 per injury collision -C$4.58 million per fatal collision. • From (Table 2), the value of safety benefits = C$514 million
In the ICBC perspective • Estimated average claim costs of: -C$40,000 for each injury collision -C$50,000 for each fatal collision • Estimated claim savings (Table 3) of C$66 million.
Summary of costs and benefits: • Net social benefit = C$115 million • The largest single benefit is the value of injuries, deaths, and property damage prevented =C$514 million/year • Photo Radar Program cost = $C27 million • Lost travel time cost = C$372 million/year
Policy implications • Greater use of highway photo radar speed enforcement would be good public policy.
Important elements that are addressed • My name and the citation of the cost benefit analysis • Primary questions addressed in the paper • Method used to analyze the questions • Data source used in the article • Results focusing on the implication for the primary questions • Policy implications