Peak Height Ratios in Forensic STR Analyses: Pattern of Occurrence & Effects of Concentration
210 likes | 487 Vues
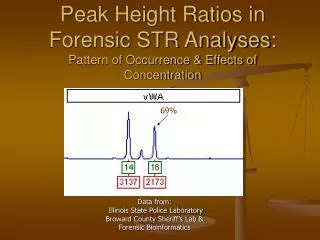
Peak Height Ratios in Forensic STR Analyses: Pattern of Occurrence & Effects of Concentration. 69%. Data from: Illinois State Police Laboratory Broward County Sheriff’s Lab & Forensic Bioinformatics. Validation. Size Ladders are Used to Make Allele Calls.

Peak Height Ratios in Forensic STR Analyses: Pattern of Occurrence & Effects of Concentration
E N D
Presentation Transcript
Peak Height Ratios in Forensic STR Analyses:Pattern of Occurrence & Effects of Concentration 69% Data from: Illinois State Police Laboratory Broward County Sheriff’s Lab & Forensic Bioinformatics
Figure from: STR ANALYSIS BY CAPILLARY ELECTROPHORESIS: DEVELOPMENT OF INTERPRETATION GUIDELINES FOR THE PROFILER PLUS™ AND COFILER™ SYSTEMSFOR USE IN FORENSIC SCIENCE by Deborah Hobson, Jill Smerick, and Jenifer Smith DNAU I, FBI Laboratory, Washington, D.C.
Frequency of Occurrence of Heterozygote Peak Height Ratios in Percentages in All Loci in the Illinois State Police Validation Studies
The mean Peak Height Ratio is significantly smaller and the variance larger for smaller DNA samples as reflected by the mean RFU of a sample. Above that threshold the mean PHR & Variance does not differ significantly among peak height classes.
Relationship between RFU & the percent of profiles with PHR’s above (Yes) and below (NO) 70%. Chi-Squared = 21.58, 4df, p = 0.00024
Amplifications from same dilution tube (~30 pg). (2-012802 10.19 AM) Allelic imbalance present. Allele dropout @ D18. “Different DNA profiles” @ D3, D21, D18 and D13.
The bottom line is simple; Peak Height Ratios have a higher probability of being imbalanced and show significantly greater imbalances in small and/or degraded samples of DNA when using Profiler Plus and Cofiler to type STR DNA in crime scene type samples. A significant number of samples at all RFU classes show Peak height ratios below 70%. This is especially true of small and/or degraded samples like those collected at many crime scenes. The Illinois State Police DNA lab’s use of a 70% rule to infer single source samples and in interpreting the relative contributions to mixtures is not justified by the data in their own “validation” studies. I have seen similar data from the validation studies of many other crime labs (e.g., Minnesota BCA, Broward County Sheriffs Lab, Bode Technology, West Palm Beach Sheriffs Office, Connecticut State Police Crime Lab, FBI Laboratory, and studies done by the kit’s manufacturers.