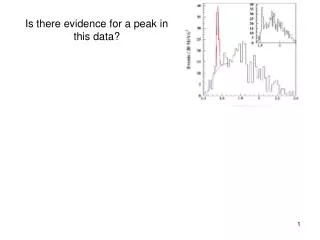
Is there evidence for a peak in this data?
910 likes | 1.04k Vues
This document investigates the statistical evidence for a peak in the CLAS data related to the observation of an exotic S=+1 baryon in exclusive photoproduction from the deuteron, highlighting its significance at 5.2 ± 0.6 σ. It delves into the Bayesian analysis of pentaquark signals, comparing different statistical models and their implications. The significance of parameter fitting, goodness-of-fit tests, and the interpretation of p-values is discussed, alongside the challenges of hypothesis testing in particle physics, particularly regarding new physics discoveries versus standard model predictions.

Is there evidence for a peak in this data?
E N D
Presentation Transcript
Is there evidence for a peak in this data? “Observation of an Exotic S=+1 Baryon in Exclusive Photoproduction from the Deuteron” S. Stepanyan et al, CLAS Collab, Phys.Rev.Lett. 91 (2003) 252001 “The statistical significance of the peak is 5.2 ± 0.6 σ”
Is there evidence for a peak in this data? “Observation of an Exotic S=+1 Baryon in Exclusive Photoproduction from the Deuteron” S. Stepanyan et al, CLAS Collab, Phys.Rev.Lett. 91 (2003) 252001 “The statistical significance of the peak is 5.2 ± 0.6 σ” “A Bayesian analysis of pentaquark signals from CLAS data” D. G. Ireland et al, CLAS Collab, Phys. Rev. Lett. 100, 052001 (2008) “The ln(RE) value for g2a (-0.408) indicates weak evidencein favour of the data model without a peak in thespectrum.” Comment on “Bayesian Analysis of Pentaquark Signals from CLAS Data” Bob Cousins, http://arxiv.org/abs/0807.1330
p-values and Discovery Louis Lyons IC and Oxford l.lyons@physics.ox.ac.uk Gran Sasso, Sept 2010
PARADOX Histogram with 100 bins Fit 1 parameter Smin: χ2 with NDF = 99 (Expected χ2 = 99 ± 14) For our data, Smin(p0) = 90 Is p1 acceptable if S(p1) = 115? • YES. Very acceptable χ2 probability • NO. σp from S(p0 +σp) = Smin +1 = 91 But S(p1) – S(p0) = 25 So p1 is 5σ away from best value
TOPICS H0 or H0 v H1 Upper limits p-values: For Gaussian, Poisson and multi-variate data Goodness of Fit tests Why 5σ? Blind analyses What is p good for? Errors of 1st and 2nd kind What a p-value is not P(theory|data) ≠ P(data|theory) Optimising for discovery and exclusion Incorporating nuisance parameters
H0 or H0 versus H1 ? H0 = null hypothesis e.g. Standard Model, with nothing new H1 = specific New Physics e.g. Higgs with MH = 120 GeV H0: “Goodness of Fit” e.g. χ2, p-values H0 v H1: “Hypothesis Testing” e.g. L-ratio Measures how much data favours one hypothesis wrt other H0 v H1 likely to be more sensitive or
p-values Concept of pdf y Example: Gaussian μ x0 x y = probability density for measurement x y = 1/(√(2π)σ) exp{-0.5*(x-μ)2/σ2} p-value: probablity that x ≥ x0 Gives probability of “extreme” values of data ( in interesting direction) (x0-μ)/σ 1 2 3 4 5 p 16% 2.3% 0.13% 0. 003% 0.3*10-6 i.e. Small p = unexpected
p-values, contd Assumes: Gaussian pdf (no long tails) Data is unbiassed σ is correct If so, Gaussian x uniform p-distribution (Events at large x give small p) 0 p 1
p-values for non-Gaussian distributions e.g. Poisson counting experiment, bgd = b P(n) = e-b* bn/n! {P = probability, not prob density} b=2.9 P 0 n 10 For n=7, p = Prob( at least 7 events) = P(7) + P(8) + P(9) +…….. = 0.03
Poisson p-values n = integer, so p has discrete values So p distribution cannot be uniform Replace Prob{p≤p0} = p0, for continuous p by Prob{p≤p0} ≤ p0, for discrete p (equality for possible p0) p-values often converted into equivalent Gaussian σ e.g. 3*10-7 is “5σ” (one-sided Gaussian tail) Does NOT imply that pdf = Gaussian
LIMITS • Why limits? • Methods for upper limits • Desirable properties • Dealing with systematics • Feldman-Cousins • Recommendations
WHY LIMITS? Michelson-Morley experiment death of aether HEP experiments CERN CLW (Jan 2000) FNAL CLW (March 2000) Heinrich, PHYSTAT-LHC, “Review of Banff Challenge”
SIMPLE PROBLEM? Gaussian ~ exp{-0.5*(x-μ)2/σ2} No restriction on μ, σ known exactly μ x0 + k σ BUT Poisson {μ = sε + b} s ≥ 0 ε and b with uncertainties Not like : 2 + 3 = ? N.B. Actual limit from experiment = Expected (median) limit
Methods (no systematics) Bayes (needs priors e.g. const, 1/μ, 1/√μ, μ, …..) Frequentist (needs ordering rule, possible empty intervals, F-C) Likelihood (DON’T integrate your L) χ2 (σ2 =μ) χ2(σ2 = n) Recommendation 7 from CERN CLW: “Show your L” 1) Not always practical 2) Not sufficient for frequentist methods
Bayesian posterior intervals Upper limit Lower limit Central interval Shortest
90% C.L. Upper Limits m x x0
(a) CLS = p1/(1-p0) (b) H0 H1 n0 n n p1 p0 n0 (c) H0 H1 n1 n0 n
DESIRABLE PROPERTIES • Coverage • Interval length • Behaviour when n < b • Limit increases as σb increases
ΔlnL = -1/2 rule If L(μ) is Gaussian, following definitions of σ are equivalent: 1) RMS of L(µ) 2) 1/√(-lnL/dµ2) 3) ln(L(μ±σ) = ln(L(μ0)) -1/2 If L(μ) is non-Gaussian, these are no longer the same “Procedure 3) above still gives interval that contains the true value of parameter μ with 68% probability” Heinrich: CDF note 6438 (see CDF Statistics Committee Web-page) Barlow: Phystat05
COVERAGE How often does quoted range for parameter include param’s true value? N.B. Coverage is a property of METHOD, not of a particular exptl result Coverage can vary with Study coverage of different methods of Poisson parameter , from observation of number of events n Hope for: 100% Nominalvalue
COVERAGE If true for all : “correct coverage” P< for some “undercoverage” (this is serious !) P> for some “overcoverage” Conservative Loss of rejection power
Coverage : L approach (Not frequentist) P(n,μ) = e-μμn/n! (Joel Heinrich CDF note 6438) -2 lnλ< 1 λ = P(n,μ)/P(n,μbest) UNDERCOVERS
Frequentist central intervals, NEVER undercovers(Conservative at both ends)
Feldman-Cousins Unified intervalsFrequentist, so NEVER undercovers
= (n-µ)2/µ Δ = 0.1 24.8% coverage? • NOT frequentist : Coverage = 0% 100%
COVERAGE N.B. Coverage alone is not sufficient e.g. Clifford (CERN CLW, 2000) “Friend thinks of number Procedure for providing interval that includes number 90% of time.”
COVERAGE N.B. Coverage alone is not sufficient e.g. Clifford (CERN CLW, 2000) Friend thinks of number Procedure for providing interval that includes number 90% of time. 90%: Interval = -∞ to +∞ 10%: number = 102.84590135…..
INTERVAL LENGTH Empty Unhappy physicists Very short False impression of sensitivity Too long loss of power (2-sided intervals are more complicated because ‘shorter’ is not metric-independent: e.g. 04 or 4 9)
90% Classical interval for Gaussian σ = 1 μ≥ 0 e.g. m2(νe)
Behaviour when n < b Frequentist: Empty for n < < b Frequentist: Decreases as n decreases below b Bayes: For n = 0, limit independent of b Sen and Woodroofe: Limit increases as data decreases below expectation
FELDMAN - COUSINS Wants to avoid empty classical intervals Uses “L-ratio ordering principle” to resolve ambiguity about “which 90% region?” [Neyman + Pearson say L-ratio is best for hypothesis testing] Unified No ‘Flip-Flop’ problem
Flip-flop Black lines Classical 90% central interval Red dashed: Classical 90% upper limit
Poisson confidence intervals. Background = 3 Standard FrequentistFeldman - Cousins