Download
1 / 85
850 likes | 992 Vues
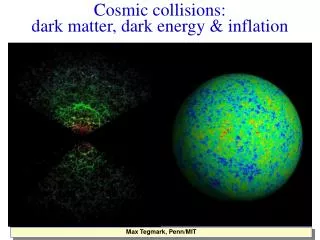
Recent evidence for gamma-ray line emission from Fermi-LAT data: dark matter or artifact?. Meng S u Pappalardo /Einstein Fellow MIT/ CfA Collaborators: Douglas Finkbeiner , Christoph Weniger Fermilab Astrophysics Seminar, March 4 th 2013.

E N D
Recent evidence for gamma-ray line emission from Fermi-LAT data: • dark matter or artifact? Meng Su Pappalardo/Einstein Fellow MIT/CfA Collaborators: Douglas Finkbeiner, ChristophWeniger FermilabAstrophysics Seminar, March 4th 2013
Vera Rubin and her colleagues: galaxies rotation curve of nearly galaxies (1970s) Fritz Zwicky's pioneering work in 1933
Standard Dark Matter Scenario: Thermal WIMP(Weakly Interacting Massive Particle) • Dark matter particles are produced and annihilating in thermal equilibrium after big bang (according to a given particle physics model). Universe is expanding and cooling. • Universe becomes too cool to continue producing DM particles. Remaining DM annihilates to standard model particles. • Universe’s rate of expansion exceeds rate of particle annihilations, making annihilations rare. • “Dark Matter Freezes Out”
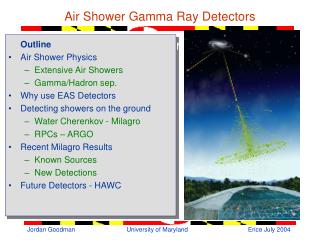
Techniques for the Indirect Detection of Dark Matter •Morphological Differentiation •Galactic Center Search •Milky Way Halo •Dwarf Spheroidal Galaxies •Anisotropy Power Spectrum •Gamma-Rays from Galaxy Clusters •Cosmic Ray Electrons/Gammas from the Sun •Spectral Differentiation •Gamma-Ray Line Search The two-body annihilation of DM into photons produces monochromatic gamma rays •e+e- ratio and electron + positron Spectrum (Recall previous talks by Alexander Belikov andLawrence Rudnick)
Gamma-Ray LineSearch • GOAL: Search for a spectral signal from an annihilation (or decay) of dark matter directly into gammarays. • Targets: Any annihilating or decaying dark matter particle which produces photons directly, or possibly produces a very hard spectrum of single photons through internal bremsstrahlung • Benefits: No astrophysical process is expect to produce a gamma-ray line. Resulting constraints can fall far below thermal cross-section •Difficulties: Direct production of gamma-gamma is not a generic prediction of dark matter annihilation or decay.
Fermi Bubble The Fermi-LAT three year maps Su& Finkbeiner (2012)
Galactic Diffuse Gamma-ray Emission (from Tsunefumi Mizuno)
Fermi Bubble Fermi Bubble from three year maps
Best limits so far: Fermi-LAT Collaboration, arXiv:1205.2739v1
How to define a search region? • Estimate the signal from DM, e.g. Einasto profile squared, projected along line of sight. • Estimate background from lower energy (1-20 GeV) photons. • Estimate S/N as DM signal/background. • Make a cut on estimated S/N.
Why the reluctance to call a sharp spectral feature a line? • Perhaps because 2 WIMPs -> 2 gammas is usually loop suppressed (in, e.g., the MSSM), so you expect a continuum 100-10,000x brighter. This was not observed, making a line impossible. • But there are other theories where a line is OK. Let’s ignore theoretical prejudice and simply ask if there is a line in the Fermi LAT data.
Timeline of 130 GeV line: 12 April - Weniger (looks like a line at 130 GeV) 26 April - Profumo & Linden (is it the Fermi bubbles?) 10 May - Tempel et al., (No, it’s not a bubble, could be DM) 21 May - Boyarsky (lots of blobs, probably not DM) 25 May - Acharya, Kane... (It’s a Wino) 29 May - Bergstrom (reviews claims as part of larger review) 30 May - Jim Cline (two lines) 30 May - Buckley & Hooper (theoretical models) 5 June - Geringer-Sameth & Koushiappas (Line search in dwarfs) 7 June - Su & Finkbeiner (Off center 1.5 deg, Einasto, 6.5sigma, usehigh energy-resolution events) (As of March2013, Wenigerpaper has 120+ citations)
Fermi-LAT maps at 100–180 GeV Su & Finkbeiner (arXiv:1206.1616)
Null tests Subtraction of other energy maps Cosmic ray contamination?
Spectrum: • Make maps in each of 16 energy bins, assume that emission in each bin is a linear combination of template maps, and plot the template coefficients. • Coefficients are determined by maximizing the Poisson likelihood of observing the observed counts given the model. • Templates choice corresponds to hypothesis to be tested.
Not from large scale Fermi bubbles 1) χ+χγ+γ 2):χ+χ Z0+γ E γ=mx-Mz2/4mx A pair of lines at 110.8±4.4 GeV and 128.8±2.7 GeV Consistent with single line at 127.3 ± 2.7 GeV
Galactic longitude and latitude profile Offset from the GC? Even though the high-incidence-angle photons (θ > 40◦; right) panels have half the exposure (9.7% vs. 19% for the left panels), they have more than half of the photons, and nearly the same TS due to lower off-line background leaking in.
High incidence angle events with better energy resolution Yvonne Edmonds PhD thesis
Galactic longitude and latitude profile Offset from the GC? Even though the high-incidence-angle photons (θ > 40◦; right) panels have half the exposure (9.7% vs. 19% for the left panels), they have more than half of the photons, and nearly the same TS due to lower off-line background leaking in.
Tests: We do not see the signal elsewhere in the Galactic plane:
The detection significance of the gamma-ray cusp for various models We do the fit in many ways. Off-center Einasto is the best.
Assessment of line profile • The 129 GeV feature shape is strikingly similar to that expected for a line. The 111 GeV feature is unconvincing, but is also compatible with a line. • In some cases, fluctuations appear, but are not present in both low and high incidence spectra. • This test did not have to succeed. The fact that the high-incidence photon sample has sharper spectral features is important.
A MODIFIED SURVEY STRATEGY FOR FERMI • Thescan strategy of Fermi-LAT could be altered for 1 year to confirm the 130 GeV line! • This current strategy is excellent for uniformity of full-sky coverage, but is far from optimal for collecting high-incidence-angle photons from the GC. • The exposure time of our (40◦ < θ < 60◦ ) sample exceeds the current strategy (observed 9.7% of the time) by more than a factor of 4. Require GC have an incidence angle of 45◦ < θ < 55◦ . • After 1 year of altered observing, we would have a sample of high incidence photons equal to the current sample, and could evaluate their significance directly, in the absence of any trialsfactor!
Vela pulsar The Crab Atwood et al. 2012
Hypothesis 1: The Galactic center is bright, soinstrumental artifacts are more significant there
Hypothesis 1: The Galactic center is bright, soinstrumental artifacts are more significant there • At E > 100 GeV, the Galactic center is only modestly brighter than the surrounding regions, away from the GC or from low/high energy (bright X-ray source?) • It is difficult to see how this could happen. • Regions with a high gamma ray-to-CR ratio, which are used for calibration purposes: enhance the impact of an instrumental effect, like e.g. energy reconstruction or acceptance anomalies that
Hypothesis 2: The Galactic center has a hard spectrum, making energy mapping errors more significant. • The GC spectrum is not much harder than the rest of the Inner Galactic plane, but the latter shows no sign of a feature at 130 GeV. • Not enough photon for >300 GeV to mimic the line!