Color
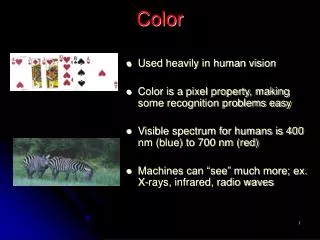
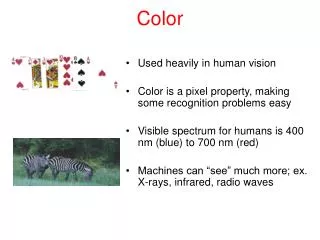
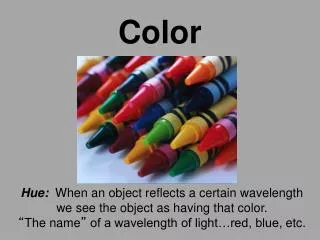
Color. Color is a psychophysical concept depending both upon the spectral distribution of the radiant energy of the illumination source and the visual sensations perceived by the viewer

Color
E N D
Presentation Transcript
Color • Color is a psychophysical concept depending both upon the spectral distribution of the radiant energy of the illumination source and the visual sensations perceived by the viewer • Color perception depends mainly upon the physics of light and the physiology of the visual system, which results in the following psychological color sensations: • hue: the color sensation associated with different parts of the spectrum such as red, yellow, or blue • saturation: the color sensation corresponding to the degree of hue in a color • brightness is the primary visual sensation
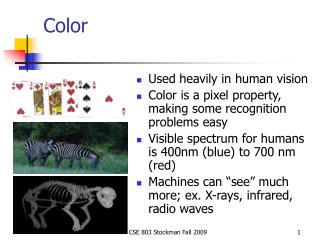
Color Science • Light is an electromagnetic wave. Its color is characterized by the wavelength content of the light. • Laser light consists of a single wavelength: e.g., a ruby laser produces a bright, scarlet-red beam. • Most light sources produce contributions over many wavelengths. • However, humans cannot detect all light, just contributions that fall in the “visible wavelengths”. • Short wavelengths produce a blue sensation, long wavelengths produce a red one. • Visible light is an electromagnetic wave in the range 400 nm to 700 nm (where nm stands for nanometer, 109 meters).
Color Science • Fig. 4.2 shows the relative power in each wavelength interval for typical outdoor light on a sunny day. This type of curve is called a Spectral Power Distribution (SPD) or a spectrum.
Human Vision • The eye works like a camera, with the lens focusing an image onto the retina (upside-down and left-right reversed). • The retina consists of an array of rods and three kinds of cones. • The rods come into play when light levels are low and produce an image in shades of gray • For higher light levels, the cones each produce a signal. Because of their differing pigments, the three kinds of cones are most sensitive to red (R), green (G), and blue (B) light.
Human Vision • The eye is most sensitive to light in the middle of the visible spectrum. • The sensitivity of our receptors is also a function of wavelength
Human Vision • These spectral sensitivity functions can be represented by a vector function • Since an SPD is a sum of single frequency lights, we can add up the cone responses for all wavelengths, waited by the sensitivity functions at those wavelengths leading to three integrals
Image Formation • Surfaces reflect different amounts of light at different wavelengths, and dark surfaces reflect less energy than light surfaces. • Fig. 4.4 shows the surface spectral reflectance from (1) orange sneakers and (2) faded bluejeans. The reflectance function is denoted S().
Image Formation • So image formation involves an illuminant with SPD E() reflects off a surface with spectral reflectance function S() and is filtered by the eyes’ cone functions q() as shown in figure 4.5 • The function C() is called the color signal and is formed by the product of the illuminant and the reflectance
Image Formation • The resulting equations, taking into account reflectance are as follows
Camera Systems • Camera systems are made in a similar fashion; studio-quality camera has three signals produced at each pixel location (corresponding to a retinal position). • Analog signals are converted to digital, truncated to integers,and stored. If the precision used is 8-bit, then the maximum value for any of R; G;B is 255, and the minimum is 0. • However, the light entering the eye of the computer user is that which is emitted by the screen|the screen is essentially a self-luminous source. Therefore we need to know the light E() entering the eye.
Gamma Correction • The light emitted is in fact roughly proportional to the voltage raised to a power; this power is called gamma, with symbol . • (a) Thus, if the file value in the red channel is R, the screen emits light proportional to R, with SPD equal to that of the red phosphor paint on the screen that is the target of the red channel electron gun. The value of gamma is around 2.2. • (b) It is customary to append a prime to signals that are gamma-corrected by raising to the power (1/ ) before transmission. Thus we arrive at linear signals:
Gamma Correction • Fig. 4.6(a) shows light output with no gamma-correction applied. We see that darker values are displayed too dark. • This is also shown in Fig. 4.7(a), which displays a linear ramp from left to right. • Fig. 4.6(b) shows the effect of pre-correcting signals by applying the power law R1/ ; it is customary to normalize voltage to the range [0,1].
Gamma Correction • The combined effect is shown in Fig. 4.7(b). Here, a ramp is shown in 16 steps from gray-level 0 to gray-level 255.
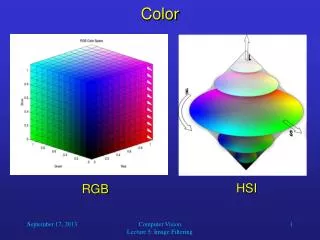
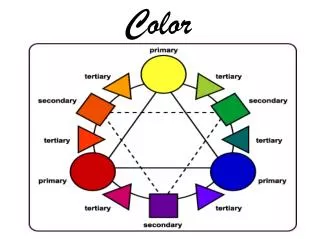
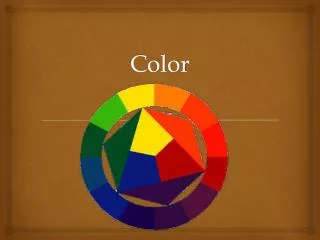
Color Systems • Combinations of three primary colors can match any unknown color for observers with normal color vision • Often, we choose red, green, and blue as the three primary colors, and we can then represent some color C by a mixture of red, green, and blue: • C = rCR + gCG + bCB • RGB is the color model (a conceptual system for specifying colors numerically) used in computer monitors • This model is additive
Color-Matching Functions • The amounts of R, G, B to match any color have been found by experiment as shown below
Color-Matching Functions • Since the red function has a negative lobe, three fake primary colors were devised that lead to primaries with only positive values • The three functions are called x(), y() and z(). • The middle function y matches the luminous efficiency curve V()
Color-Matching Functions • For a general SPD E(), the essential “colorimetric” information required to characterize a color is the set of tristimulus values X, Y , Z defined in analogy to (Eq. 4.2) as (Y == luminance):
Color-Matching Functions • The CIE devised a 2D diagram representing the 3D (X,Y,Z) values as shown below
White Spectra • The CIE defines several “white” spectra: illuminant A, illuminant C, and standard daylights D65 and D100. (Fig. 4.12)
CIE Diagram • Chromaticities on the spectrum locus (the “horseshoe” in Fig. 4.11) represent “pure” colors. These are the most “saturated”. Colors close to the white point are more unsaturated. • The chromaticity diagram: for a mixture of two lights, the resulting chromaticity lies on the straight line joining the chromaticities of the two lights. • The “dominant wavelength” is the position on the spectrum locus intersected by a line joining the white point to the given color, and extended through it.
Color Monitor Specifications • Color monitors are specified in part by the white point chromaticity that is desired if the RGB electron guns are all activated at their highest value (1.0, if we normalize to [0,1]). • We want the monitor to display a speci ed white when when R’=G’=B’=1. • There are several monitor specifcations in current use (Table 4.1).
Out of Gamut Colors • We can use the monitor specifications to convert a CIE (x,y,z) triple into RGB values for the monitor
Out of Gamut Colors • What do we do if any of the RGB numbers is negative? - that color, visible to humans, is out-of-gamut for our display. • One method: simply use the closest in-gamut color available, as in Fig. 4.13. • Another approach: select the closest complementary color.
RGB Color Model for CRT Displays 1. We expect to be able to use 8 bits per color channel for color that is accurate enough. 2. However, in fact we have to use about 12 bits per channel to avoid an aliasing effect in dark image areas - contour bands that result from gamma correction. 3. For images produced from computer graphics, we store integers proportional to intensity in the frame buffer. So should have a gamma correction LUT between the frame buffer and the CRT. 4. If gamma correction is applied to floats before quantizing to integers, before storage in the frame buffer, then in fact we can use only 8 bits per channel and still avoid contouring artifacts.
Color Systems • CMYK is the color model used by printing presses • This model is subtractive • Light is absorbed, or subtracted by cyan, magenta, and yellow ink • In process-color printing, layers of translucent inks are used, each subtracting certain colors of light • Colors that are not absorbed pass through to the paper below which reflects all color • For example, magenta ink looks magenta because it allows magenta light to pass through but absorbs all other colors
Device Independent Color Systems • It is very difficult to accurately specify color since the perceived characteristics cannot be measured directly • Print shops use swatch books (e.g. Letraset’s Pantone Matching System) of named, numbered colors to accurately specify colors • Differences in press settings, and ink and paper brands may result in different colors being printed • For this reason, there is a rising interest in device-independent color systems
Device Independent Color Systems • L*a*b color model is an international standard for color measurement • It is designed to be device independent, creating consistent colors regardless of the device used to create or output the image • L is the luminance or lightness component • a is the is the green to red component • b is the blue to yellow component
Color Models in Video • Video Color Transforms (a) Largely derive from older analog methods of coding color for TV. Luminance is separated from color information. (b) For example, a matrix transform method similar to Eq. (4.9) called YIQ is used to transmit TV signals in North America and Japan. (c) This coding also makes its way into VHS video tape coding in these countries since video tape technologies also use YIQ. (d) In Europe, video tape uses the PAL or SECAM codings, which are based on TV that uses a matrix transform called YUV. (e) Finally, digital video mostly uses a matrix transform called YCbCr that is closely related to YUV
YUV Color Model • YUV color model has one luminance channel (Y) and two chrominance (color) channels - U and V • The chrominance channels actually represent the difference between colors and a reference white (luminance) • Luminance represents the grayscale (black and white) information • For B/W television, the U and V can be ignored
YIQ Color Model • The YIQ color model is used in NTSC TV • The Y is the same as in YUV • I and Q are phase shifted from U and V to allow for more efficient transmission • Note that the chrominance information is less perceptually important than the luminance, and hence less bandwidth is used for it
YCbCr Color Model • Finally, the YCbCr color model is used in the Rec. 601 digital video standard. • Cb and Cr are the chrominance components