Download
1 / 39
400 likes | 510 Vues
Explore the importance of physical activity in public health, descriptive patterns, related health conditions, and gaps in disparities research. Learn about the benefits and guidelines for physical activity.

E N D
Health Disparities in Physical Activity: Patterns and Implications Ross C. Brownson Prevention Research Center Saint Louis University School of Public Health http://prc.slu.edu
Learning Objectives 1. To understand the importance of physical activity as a public health issue 2. To understand the descriptive patterns in physical activity, related health conditions, and macro factors (e.g., demographics) 3. To review the gaps and implications for health disparities research and practice.
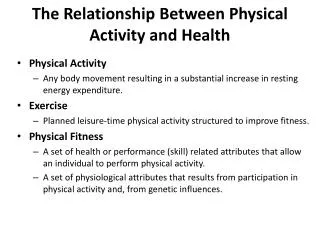
Definitions: Behaviors • Physical Activity: “any bodily movement produced by skeletal muscles that results in energy expenditure.” • Occupational, household, exercise, sports, play • Exercise: “planned, structured, and repetitive bodily movement done to improve or maintain one or more components of physical fitness.” • Running, aerobic dance, bicycling, calisthenics Caspersen C, et al, Public Health Reports 1985; 100(2)126-131.
Lowers risk for heart disease Reduces risk for certain cancers Lowers blood pressure Improves lipid profile Prevents obesity Prevents diabetes Builds healthy bones Enhances immune function Relieves stress and improves mood Promotes self-esteem Increases aerobic capacity Increases strength Increases flexibility Improves balance and coordination Increases functional Health: Allows us to do the things we need to do and want to do with ease and enjoyment! The Benefits of Physical Activity Health Benefits Fitness Benefits
Physical Activity and Health (Dose-Response) Prevention of Weight Gain Diabetes Mellitus Risk of “Disease” CHD Stroke Functional Health Status Musculoskeletal Injury Physical Activity
Fit or Fat?CVDMortality, % Body Fat, and Fitness *adj for age, exam year, smoking, alcohol, & fam history 25% <16% 16-<25% Lee CD et al. Am J Clin Nutr 1999.
The Chronic Disease Epidemic: Changing Environment Acting upon Pre-existing Genes Phenotype = Genotype x Environment No Change in past 100 Years Unhealthy Gene Expression Large Change in past 100 Years *Physical Inactivity Diet Pollution, etc.
CDC/ACSM recommendations on the types and amounts of physical activity needed for health promotion and disease prevention: • Every US adult should accumulate 30 minutes or more of moderate-intensity physical activity on most, preferably all, days of the week. • Moderate-intensity - Activity performed at 3 to 6 times the resting metabolic rate. • Equivalent to brisk walking 2 miles at 3 to 4 mph (15 to 20 minutes/mile) for healthy adults
Accumulating Physical Activity? • Guidelines allow for the accumulation of moderate-intensity physical activity over the course of a day • Five recent studies compared the traditional 30 minutes of continuous activity vs. shorter (5- to 15-minute) bouts of activity spread throughout the day • Shorter bouts resulted in comparable improvements in cardiorespiratory fitness and health • Multiple short bouts of physical activity also appear to increase participation and adherence
0 2 4 12 14 16 18 20 22 24 6 8 10 The Lifestyle Approach Noon-timejog 10 Sedentary 8 Structured Exercise Lifestyle Activity 6 Energy Expenditure (METS) After-dinner walk Walk to bus stop 4 2 0 Blair et al. Med Exerc Nutri Hlth 1:54, 1992 Time (hours)
Physical Activity Levels Survey Measures • Recommended level • Moderate-intensity activity 5 times per week for 30 minutes each time, • Vigorous-intensity 3 times per week for 20 minutes each time, or • Both • Insufficient • Some activity but not enough to be classified as moderate or vigorous • Inactive • No leisure-time physical activity during the preceding month
Possible Domains of Physical Activity • Leisure/recreational • Occupational • Transportation • Household chores • Gardening/yardwork • Completely sedentary activities (e.g., watching television)
Descriptive Epidemiology 1. Person 2. Place 3. Time
Classify PERSON age race sex ses family occupational blood type marital status personality traits migrants
Physical Activity by Race/Ethnicity(2003 BRFSS, Age-Adjusted)
Moderate Physical Activity for Adults by Disability and Arthritis Status Age-adjusted percent 1997 2002* 2010 Target With Without With Without Disabilities Arthritis
Physical Activity in Ethnically Diverse Women 40 and older Brownson RC et al. Am J Public Health 1999.
Vigorous Physical Activity for Adolescents by Grade Level: 2001 Percent 10th 12th 9th 11th
Classify PLACE natural boundaries political subdivisions urban-rural differences weather variations
Age-adjusted percent (Quartiles) 15.0 - 20.0 20.5 - 22.4 23.0 - 26.2 26.4 - 30.2 No Physical Activity for Adults by State, 2003
Classify TIME secular trends declining rates cyclicity-seasonality periodicity clusters in time or place
Other important macro patterns & trends in the United States that are likely to affect health disparities and the burden of physical inactivity
Population Trends Aging of the Population • 65+ the most rapidly growing US segment • Projected increases 65+: • 1990, 31 million • 2010, 40 million • 2030, 70 million • Large impacts on public health and health care systems
Population Trends Changing Racial/Ethnic Makeup • Non-Hispanic Whites • 1992, 191 million to 202 million in 2050 • African American • 1992, 32 million to 62 million in 2050 • Asian/Pacific Islander • 1992, 9 million to 41 million in 2050 • Distinguish counts from percentages • Large potential effects on disease burden • Issues of cultural competence
Car ownership, walking & biking Percent by Walking or Biking
Vehicle miles traveled by automobile Miles per person per day
Ave. daily television viewing Hours per household per day
Knowledge Gaps • Do correlates differ between majority and minority populations? • What data are lacking (for both descriptive and analytic epidemiology)? • How generalizable are various, tested interventions? • How do we do a better job in assessing context for intervention among population subgroups?
Acknowledgments Certain slides were provided by Dr. Greg Heath (Centers for Disease Control and Prevention) and Dr. Steve Blair (Cooper Institute)