Download
1 / 25
250 likes | 571 Vues
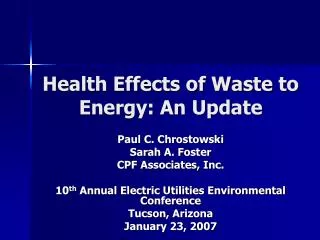
Health Effects of Waste to Energy: An Update. Paul C. Chrostowski Sarah A. Foster CPF Associates, Inc. 10 th Annual Electric Utilities Environmental Conference Tucson, Arizona January 23, 2007. Waste to Energy (WTE). Combustion of municipal solid waste with energy recovery

E N D
Health Effects of Waste to Energy: An Update Paul C. Chrostowski Sarah A. Foster CPF Associates, Inc. 10th Annual Electric Utilities Environmental Conference Tucson, Arizona January 23, 2007
Waste to Energy (WTE) • Combustion of municipal solid waste with energy recovery • In US, 89 plants with capacity of 99,000 TPD generate 2,500 MW of electricity • About 14% of US MSW waste stream • Municipal solid waste is a sustainable, renewable source of fuel
Some Milestones in WTE Health Evaluation History • First WTE facility 1975 Saugus, MA • 1982 Barry Commoner raises dioxin issue • Early 1980s incinerator risk assessments • Mid-1980’s Connett attacks incinerator risk assessment • 1990 CARB risk guidelines nonhazardous waste • 1995 NSPS (MACT Rule) • 1998 EPA Hazwaste incinerator risk guidelines (HHRAP) • 2000 NAS/NRC report
2000 NAS/NRC Report • Emissions from newer, well-run, facilities are expected to contribute little to environmental concentrations and to health risks • Numerous specific recommendations • Distinction between pre- and post-NSPS facilities
Since NAS/NRC Report Was Written • Full implementation of NSPS • Standardization of risk assessments (HHRAP) • Numerous additional studies of potential impacts of WTE
Dioxin Emissions from WTE • Due to implementation of NSPS, state regulations, and technological improvements, WTE dioxin emissions have dramatically declined over 13 years.
Risk Assessments • Calculate probability and nature of health effects from existing or proposed emissions data • Initial assessments (early 1980s) left to discretion of analyst • WTE opponents attacked flexibility of process • Standardization of process (CARB, HHRAP) leaves little discretion in current assessments
Spokane WA Risk Assessment • 800 TPD capacity, 26 MWe, NSPS • Risks based on 10 years of stack testing • Risk assessment per HHRAP evaluated 6 receptors, 9 pathways, 77 COPCs • Cancer risks from 3 x 10⁻⁸ to 4 x 10⁻⁶; non-cancer HI from 0.03-0.26 Study Performed by Pioneer Technologies
Montgomery County MD Risk Assessment • 1800 TPD capacity, 60 MWe, NSPS • Risks based on 8 years of stack testing • Risk assessment per HHRAP evaluated 10 receptors, 9 pathways, 19 COPCs • Cancer risks from 2 x 10⁻⁸ to 7 x 10⁻⁷; non-cancer HI from 0.001-1.0. Study Performed by ENSR
Lee County FL Risk Assessment • 1980 TPD capacity, 60MWe, NSPS • >10 years of stack testing data • Risk assessment per HHRAP evaluated 8 receptors, 5 pathways, 8 COPCs • Cancer risks from 1 x 10⁻⁷ to 1 x 10⁻⁶; non-cancer HI from 5 x 10⁻⁵ to 0.1 • Included ecological risk assessment Study Performed by CPF Associates
Risk Assessment Observations • EPA HHRAP provides standardization, conservatism, complexity • PCDD/Fs and Hg are risk drivers • Bioaccumulative pathways (beef, milk, fish consumption) dominate risks • Cancer risks <10-5; as low as 10-8 depending on exposure assumptions • Non-cancer hazard indices ≤ 1 • UK risk assessments corroborate US
Special Case of Hg • Highest non-cancer risks typically associated with MeHg in fish • HHRAP inadequate for Hg speciation, environmental fate, toxicity • IEM-2M model developed for Hg RTC has greater capabilities • Dissolved MeHg water column concentrations and fish ingestion HQs about 50X higher using HHRAP vs IEM-2M
Environmental Studies • Rely on measurements of chemicals potentially associated with WTE in environment/biota • Numerous studies of varying quality dating from late 1980s presented in NAS report. Generally found no association between chemicals and operation of WTE facilities.
Montgomery County MD Environmental Study • Monitored air, soil, earthworms, cow’s milk, forage, vegetables, surface water, sediment, fish • Locations determined by air modeling • Analyzed PCDD/F, PAH, PCB, As, Be, Cd, Cr, Pb, Hg, Ni • No statistically significant increases or consistent patterns post- vs pre-operation Study Performed by R.F. Weston
Union County NJ Environmental Study • Monitored air, soil, sediment, surface water, food crops, fish • Analyzed TCDD, PCB, As, Be, Cd, Cr, Pb, Hg, Ni • No differences between pre- and post operation Study Performed by Paulus, Sokolowski & Sartor/HDR
Epidemiologic Studies • Attempts to measure excess relative risk associated with WTE operation • Shy et al. (1995) updated by Hu et al. (2001) only US published study; included population potentially exposed to WTE, medical and industrial waste incinerators. • No increased incidence in acute or chronic respiratory symptoms; possible association for lung function in 1 of 3 years of study using 1 of 4 exposure metrics.
A Descriptive Epidemiologic Cancer Study • Community concerns re: cumulative effects of 3 WTE + 1 medwaste incinerator in NE Massachusetts • Facilities pre-dated NSPS • Distance from facility and wind direction used as exposure metric • No elevated incidence of total or 6 potentially environmentally related cancers Study Performed by CPF Associates/Becker & Associates
Problems with Epidemiologic Studies • Long cancer latencies • Inadequate characterization of exposure • Multiple sources • Chemical and other confounders (including behavioral, socioeconomic) • Poor power (low risks) • Old plants
European Studies(with caveats) • WTE more used in Europe – more facilities, more research • In 2002, EU had 400 WTE facilities with combined capacity of 52 X 106 tonnes/year • Regulatory regimes differ (US 13 ng/dscm total PCDD/F @ 7% O2; EU 0.1 ng/Nm3 TEQ @6% O2)
Enviros/DEFRA (2004) • Exhaustive review of health effects of MSW management in UK • Incineration emissions lower than domestic heating or cooking • Found no epidemiologic link between MSW incineration and cancer or respiratory disease • MSW incineration may cause 0.15 deaths, 0.0005 cancers, 0.001 hospital admissions for cardiovascular illness and 4 hospital admissions for respiratory illness annually
Rabl & Spadaro 2002 • Evaluated impact of EU regulations on MSW incineration • Found that health impacts of MSW incinerators insignificant using: • Chemical concentration compared to background • Chemical concentration compared to health guidelines • Health risks of pollutants compared to each other • Increased damage cost compared to cost of incineration • Difference in emissions compared to other emissions sources • Differences in years of life lost compared to other everyday risks
Conclusions • Additional 6+ years of study confirm NAS conclusions of little health risk from newer, well operated facilities • NSPS appears to have been very effective at limiting emissions and thus risks • Epidemiology is not feasible for single facilities and may not be feasible for WTE in general • Standardization of risk assessment removed uncertainty from process and allowed for streamlined analysis