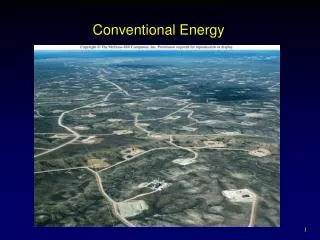
Conventional Energy
Conventional Energy. Outline. Energy History How Energy Is Used Coal Oil Natural Gas Nuclear Power Fission Reactors Waste Management Fusion. WHAT IS ENERGY. Work - Application of force through a distance. Energy - The capacity to do work. Power - Rate at which work is done.

Conventional Energy
E N D
Presentation Transcript
Outline • Energy History • How Energy Is Used • Coal • Oil • Natural Gas • Nuclear Power • Fission • Reactors • Waste Management • Fusion
WHAT IS ENERGY • Work - Application of force through a distance. • Energy - The capacity to do work. • Power - Rate at which work is done. • Calorie - Amount of energy necessary to heat 1 gram of water 1o C. • Joule - Amount of work done when a force of 1 newton is exerted over 1 meter.
PENNSYLVANIA-NEW JERSEY-MARYLAND INTERCONNECTOR (PJM) • PJM Interconnection coordinates the movement of electricity through all or parts of Delaware, Illinois, Indiana, Kentucky, Maryland, Michigan, New Jersey, North Carolina, Ohio, Pennsylvania, Tennessee, Virginia, West Virginia and the District of Columbia. The PJM region has an area of 168,500 square miles, a population of about 51 million and a peak demand of 144,644 megawatts.
NorthEast Power Blackout of 2003 50 million lost power Included Baltimore Cause?
In February 2004, the U.S.-Canada Power System Outage Task Force released their final report, placing the main cause of the blackout on FirstEnergy Corporation's failure to trim trees in part of its Ohio service area. The report said that a generating plant in Eastlake, Ohio (a suburb of Cleveland) went offline amid high electrical demand, and that strained high-voltage power lines (located in a distant rural setting) later went out of service when they came in contact with "overgrown trees". The cascading effect that resulted ultimately forced the shutdown of more than 100 power plants.[10] • No one was warned of the impending problem because of a software bug.
Energy History • Muscle power provided by domestic animals has been important since dawn of agriculture 10,000 years ago. • World oil use peaked in 1979. • Oil prices rose ten-fold in 1970’s. • Early 1980’s saw increased interest in conservation and renewable energy. • Oil glut in mid 1980’s caused prices to fall. • U.S. now imports over half annual oil supply.
Current Energy Sources • Fossil fuels currently provide about 86% of all commercial energy in the world. • Hydroelectric dams supply about 7% of commercial power. • Nuclear power makes up about 6.5 % of commercial power, but about 20% of electric power in more-developed countries.
Per Capita Consumption • Richest 20 countries consume nearly 80% of natural gas, 65% of oil, and 50% of coal production annually. • On average, each person in the U.S. and Canada uses more than 300 GigaJoules of energy annually. • In poorest countries of the world, each person generally consumes less than one GJ annually.
HOW ENERGY IS USED • Largest share of energy used in the U.S. is consumed by industry (33%). • Residential and Commercial buildings use 20% of primary energy consumed in U.S.. • Transportation consumes about 27% of all energy used in the U.S.. • Three trillion passenger miles and 600 billion ton miles of freight carried annually by motor vehicles in the U.S..
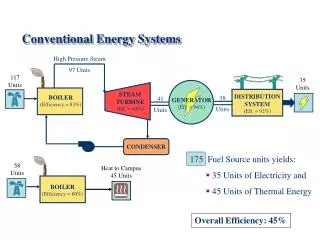
How Energy Is Used • About half of all energy in primary fuels is lost during conversion to more useful forms while being shipped, or during use. • Nearly two-thirds of energy in coal being burned to generate electricity is lost during thermal conversion in the power plant. • Another 10% is lost during transmission and stepping down to household voltages.
COAL • Fossilized plant material preserved by burial in sediments and compacted and condensed by geological forces into carbon-rich fuel. • Most laid down during Carboniferous period (286 million to 360 million years ago).
Coal • Formed from plant remains • http://www.hk-phy.org/energy/power/source_phy/flash/formation_e.html
Coal • Resources and Reserves • World coal deposits are ten times greater than conventional oil and gas resources combined. • Under current consumption rates, this could last several thousand years.
Coal • Mining • Between 1870 and 1950, more than 30,000 coal miners died of accidents and injuries in Pennsylvania alone. • Several thousands have died of respiratory diseases. • Black Lung Disease - Inflammation and fibrosis caused by accumulation of coal dust in the lungs or airways.
TYPES OF MINING • Strip mining • Underground • Mountain Topping
STRIP MINING COAL • Areas identified with below surface coal are bulldozed, top soil/rocks removed • Explosives use to create holes for excavation • Long “strips” of land bulldozed for coal • Overburden moved elsewhere • Land must be “reclaimed” back to natural state per Strip Mining Control and Reclamation Act of 1977 • Funded by 35 cents tax on every ton of coal strip mined
UNDERGROUND COAL MINING • 3 types • Shaft • Slope • Drift
UNDERGROUND COAL MINE • Use of heavy equipment and explosives to blast, grind and bring coal to surface • Dangerous; gas explosions, cave-ins
Environmental Effects of Underground Coal Mining • Land disturbance/ecosystem disruption • Land subsidence • Acid mine drainage – sulfur from coal mixes with stream water and acidifies stream; kills stream organisms • Dust and noise pollution • Release of natural methane from coal gas seams into atmosphere = increased global warming
MOUNTAIN TOPPING • Removal of entire mountain top by blasting with high explosives; followed by stripping out coal • “Overburden” (unusable remains) dumped in local valleys • Area is not returned to natural state when mining complete • Cheaper than strip mining, more profitable for owners/investors • Requires fewer workers, more unemployment/economic problems for areas already economically depressed • Now common practice in West Virginia, Kentucky, Tennessee and Virginia • 400,000 acres affected so far, with 1200 sq. miles of streambeds impacted by effects
MOUNTAIN TOPPING – ENVIRONMENTAL EFFECTS • Greater environmental devastation; loss of entire ecosystems • Air and water pollution from dirt and coal dust; inhaled by humans, fish get trapped in gills • other chemicals cause water acidification, killing aquatic life • Dust coats tree leaves, kills • “Slurry pits” with overburden can wash downstream; slurry behind dams can burst through, spreading disaster
Coal • Air Pollution • Coal burning releases radioactivity and toxic metals into the atmosphere. • Coal combustion is responsible for 25% of all atmospheric mercury pollution in the U.S.. • Coal contains up to 10% sulfur by weight. • Unless removed by washing or flue-gas scrubbing, sulfur is released and oxidizes to sulfur dioxide or sulfate. • Acid rain
Coal Ash • Remnants left over after burning of pulverized coal • Impounded in slurry ponds or behind earthen dam walls • Toxic
Harriman Tennessee Coal Ash Disaster • Harriman Tennessee, 12/22/08 – 5.4 million cubic yards of slurried coal ash breaks through earthen dam; contents can cover 3000 acres 1 foot deep • Covers land, destroys home • Mercury, lead and arsenic from coal ash now found in local well water • Coal ash also contains radioactive components • http://www.nytimes.com/2008/12/27/us/27sludge.html?_r=1&scp=1&sq=Harrimann%20Tennessee%20Dam%20disaster&st=cse
CLEAN COAL – REAL OR MYTH? • Public relations term to allay fears of coal use and global warming by coal industry • Cleaning coal includes chemically washing minerals and impurities from the coal, gasification, treating the flue gases with steam to remove sulfur dioxide, and carbon capture and storage technologies to capture the carbon dioxide from the flue gas. • addresses atmospheric problems resulting from burning coal • Concerns exist regarding the economic viability of technologies and timeframe of delivery, high hidden economic costs in terms of social and environmental damage , and the costs and viability of disposing of removed carbon and other toxic matter.
OIL • Petroleum is formed very similar to oil - Organic material buried in sediment and subjected to high pressure and temperature. • Oil pool usually composed of individual droplets or thin film permeating spaces in porous sandstone or limestone. • At least half of total deposit is usually uneconomical to pump out. • Secondary oil recovery techniques.
Oil • How oil is formed • http://www.hk-phy.org/energy/power/source_phy/flash/formation_e.html
OIL • Resources and Reserves • Total amount of oil in the world is estimated at 4 trillion barrels. (Half is thought to be ultimately recoverable) • In 2003, proven reserves were estimated at 1 trillion barrels. • As oil becomes depleted and prices rise, it will likely become more economical to find and bring other deposits to market.
Oil • Imports and Domestic Supplies • The U.S. has used about 40% of its original recoverable petroleum resource. • Of the 120 billion barrels thought to remain, 58 billion are proven-in-place. • Until 1947, the U.S. was the world’s leading oil export country. • By 1998, the U.S. was importing 10 million barrels per day - Half of total consumption.
OPEC • Organization of Petroleum Exporting Countries • Includes Iran, Iraq, Kuwait, Saudi Arabia, and Venezuela (founding countries) • Also Qatar, Libya, United Arab Emirates, Algeria, Nigeria, Ecuador • Their mission statement – “coordinate their oil production policies in order to help stabilise the oil market and to help oil producers achieve a reasonable rate of return on their investments. This policy is also designed to ensure that oil consumers continue to receive stable supplies of oil. “ OPEC website
OPEC • Formed during 1960’s • Member Countries took control of their domestic petroleum industries and acquired a major say in the pricing of crude oil on world markets. • There were two oil pricing crises, triggered by the Arab oil embargo in 1973 and the outbreak of the Iranian Revolution in 1979, but fed by fundamental imbalances in the market; both resulted in oil prices rising steeply. • Third oil crisis occurred in 1986 from a collapse following peak oil prices falling dramatically. Reasonable prices were established as a result.
OPEC • 1990’s Gulf War • Expulsion of Iraqi forces under Saddam Hussein from Kuwait after invasion • 10% of Kuwait’s oil reserves burned by retreating Iraqi forces • 2001-2008 – 9/11 and Oil Speculation saw sharp increased in oil prices • Caused massive increases in oil prices worldwide (oil price “bubble”) which increased gas and fuel prices worldwide • Led to use of less oil; this drop in demand sharply dropped prices to their current levels
Oil • Oil Shales and Tar Sands • Estimates of total oil supply usually do not reflect large potential from unconventional oil sources such as shale oil and tar sand. • Could potentially double total reserve.
US Oil Shale and Tar Sands • 800 billion barrels of recoverable barrels of oil from Oil shale • 12 to 19 billion barrels of recoverable oil from Tar Sands • All on federally owned properties
Environmental Impact of Oil Shale Mining and Processing • global warming and greenhouse gas emissions, • disturbance of mined land • disposal of spent shale • use of water resources • impacts on air and water quality • significant social and economic impacts on local communities • relatively high cost of producing oil from oil shale (currently greater than $60 per barrel) • lack of regulations to lease oil shale.
Tar Sand Processing Tar sand is strip-mined from land Sand and tar placed in hot water Black bitumen separated from the sand Diluted with other hydrocarbons for further processing into oil