Download
1 / 22
260 likes | 634 Vues
Remote Sensing of Troposphere Ozone. Discussion Prepared by: Drew Silverman. Brief Outline. Abstract Why Tropospheric Ozone Content is Important for Us Theory and Practicality of Sensing Ozone United States Findings/Results Future of Remote Sensing for Tropospheric Ozone

E N D
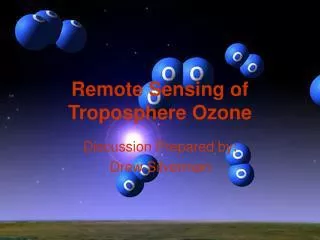
Remote Sensing of Troposphere Ozone Discussion Prepared by: Drew Silverman
Brief Outline • Abstract • Why Tropospheric Ozone Content is Important for Us • Theory and Practicality of Sensing Ozone • United States Findings/Results • Future of Remote Sensing for Tropospheric Ozone • Public Policy and Conclusions
Abstract • Due to the deterioration of the ozone in the stratosphere, the remote sensing of Ozone has become a popular topic in scientific journals. I will discuss the analysis of troposphere ozone, which can be harmful to humans when contacted in large amounts for certain period of times. I will investigate fully the Earth Probe TTO and Nimbus-7, ability to detect and diagnose lower atmospheric Ozone. It has been shown recently that Nimbus-7 has an effective resolution in detecting troposphere Ozone and is currently being researched to improve the equations used in modern day remote sensors. After offering an analysis of remote sensing equipment and it's effectiveness in sensing ozone, I will discuss the practical implications remote sensing of this lower troposphere phenomenon can have on human health. On a global level, troposphere Ozone can be sensed daily. This contributes directly to a constant science that needs to be monitored. I will discuss public policy and what changes could be brought about with successful sensing of this known pollutant. I will later discuss the future of Ozone detection and what may be necessary to improve the science itself specifically.
Ozone Exceedance Defined as: Exceedance days are defined with an 8-hour average ozone concentration of more than 110 mg/m3 or 0.075 ppm (the threshold value for protection of human health) at ground level. Source: EPA-ETC/AQ
Effects of Ozone • Short Term Exposure (< 8 Hours to 0.085 ppm) (2) • Coughing • Shortness of breath • Pain on inhalation • Long Term Exposure (>4 Days to 0.085 ppm) (2) • Increased frequency of asthma attacks • Increased use of health care services • Death reported in the elderly due to loss of lung capacity • Childhood asthma shows direct correlation to exposure • Biosphere suffers due to plant destruction
Effects of Ozone (cont) • Ozone occur an average of 20 times yearly in New Jersey (1). • Colliers Mills, NJ (<10 miles from Jackson) saw 32 exceedance days in 2003 (1). • These type of days result in high summer respiratory problems in all ages, but particularly the elderly.
What Causes Ozone? • What Causes Buildup of Tropospheric Ozone? (2) • Biomass Burning • Tropopause “transmission”- Gradient forces cause a exchange of ozone between stratosphere and troposphere. • Sea Breeze Circulation – Daily sea breezes cause recycling of old ozone leading to higher concentrations. • Heavy Industry – Leading cause of Ozone • Solar Heating – Main catalyst in creating tropospheric Ozone. • Ozone formation is considerably enhanced by presence of hydrocarbons and oxides of nitrogen in the air. Ozone is formed only with the help of the solar radiation. The highest concentrations occur generally in the afternoon hours.
Problems with Sensing Tropospheric Ozone • Unlike stratospheric ozone, lower levels are more sensitive to ground level changes (e.g.. pollution, forest fires) causing small scale anomalies. • Resolution of current remote sensors is usually poorer than 1 degree latitude by 1 degree longitude, this resolution would only account for the median ozone level in the pixel resolution. This would be equivalent to a measurement from just north of Washington D.C. to New York City. • Measurements have also shown to be inconsistent at times with ground level records (3). • Heavy clouds and weather conditions often lead to skewed data (3).
Theory • Many satellite manufactures claim there product can accurately this is a tough buy considering all the interferences that could occur. • The principle of detection uses albedo as a ratio of backscattered UV back to the satellite. Ozone absorbs strongly in the UV region of 312-380 nm. Comparing what fraction of the incoming radiance in this band is reflected back to the passive sensor, it is possible to relate this value to the total ozone amount. To map total ozone, the instrument scans through the sub satellite point in a direction perpendicular to the orbital plane. According to the principles of sounding, the instruments can retrieve a vertical profile of 6 different elevations (given the current technology) of ozone. Data from the most absorbing band come primarily from the top of the stratosphere, whereas data from the least absorbing come from nearer the ground surface; it is therefore possible to get a profile at six different altitudes of data. • Although several algorithms are used to correct for the many possible interferences, several sources of uncertainty remain in the ozone determination. Total uncertainty has been estimated around 5.5%, mainly due to troposphere ozone, retrieval errors and uncertainties in the ozone molecular cross section for the absorption. Other sources of interference, localized in space and time are volcanic aerosols, PST, high terrain and rarely, solar eclipses (1).
Nimbus-7 • The TOMS (Total Ozone Mapping Spectrometer) program began with the launch of TOMS Flight Model #1 on the Nimbus-7 spacecraft on October 24, 1978 (4). • SBUV (Solar Backscatter Ultraviolet) instrument onboard the Nimbus 7 spacecraft alarmed scientists to the disintegration of the Ozone Layer in the arctic. • TOMS instrument failed on May 7, 1993.
Nimbus-7 Specs • Designation – 11080 / 78098A • Launch date - 24 Oct 1978 • Country- United States • Primary Mission - Meteorology • Perigee/Apogee - 944/956 km • Inclination - 99° • Period - 104 min • Orbital cycle - 6 days • Mass at launch - 827 kg (4)
Modified Residual Method • Nimbus-7 used the “Modified Residual Method” to determine troposphere ozone concentration (3). • The modified residual method determines ozone profile information in the troposphere by combining measurements of cloud top pressure and above-cloud column ozone measurements of Nimbus 7 Total Ozone Mapping Spectrometer (TOMS) above-cloud column ozone and Nimbus 7 Temperature Humidity Infrared Radiometer (THIR). This combination leads to a estimation in ground level ozone concentration (3).
After Volcanic Eruption.. Source- (4)
Ozone Concentration from Nimbus Source- (4)
Nimbus-7 Downfalls • Old technology and equations led to a high error (>5.5%) on lower tropospheric ozone (4). • Equipment was struck several times by “space junk” damages the lenses on the ozone sensors. • New improved sensors (like NASA’s AURA) into orbit after 2000 (5).
Earth Probe TTO Specs • Product: TOMS Modified Residual (5) • Temporal Coverage: Aug 8 - Sep 29, 2000 • Spatial Coverage: lat (-25 - 0), Long (-41 - +75) Frequency: Daily 9-Day Averages • Format: Data = ASCII Image = GIF • Resolution: 1 deg Latitude by 2 deg Longitude
Earth Probe TTO Cont. Relatively Low Resolution Product... • Relatively Low Resolution • Poor capability in showing the flow of biomass burning and or significant events (Sept 11. attacks). • Works well in performing basic global ozone patterns. • Capable of calculating sophisticated products from raw Ozone Data. Source- (4)
Post Data Products GIS Integrated Counties.. • The Earth Probe, while not high resolution, can create many level III products. • GIS is integrated into the data base of the Earth Probe for use in analysis (5). Source- (4)
The Future • Thermal Emission Spectroscopy- Using satellite IR sensors to integrate data to the TOMS sensor on cloudy days. Completing a full image that would have normally been incorrect due to lack of accurate ground level IR emission results (5). • Higher Resolution- The current resolution is not conducive to air pollution modeling. This will be changed in the next 20 years. NASA’s goal is to put into orbit a sensor that has less than ½ degree lat/long resolution (5). • More Level III products- More integration of air pollution modeling by incorporating calculations within the sounder (5).
Public Policy • Perhaps with a higher spatial resolution of our remote sensors, more attention will be brought to this particular harmful pollutant. Unfortunately, exceedances occur often in the United States, especially here in the North-East. • The alarm in stratospheric ozone has taken a lot of the attention off what is around us here at the surface. • Proposals have been rejected to lower the exceedance standard to 100 mg/m^3 in 2006 (5).
Sources • Nimbus-7: http://toms.gsfc.nasa.gov/n7toms/n7sat.html (2) EPA: http://www.epa.gov/03healthtraining.com (3) Thermal Emission Spectroscopy: http://tes.asu.edu/newwhatstes.html (4) Private Study by David Ahrens: Article in issue 36 of Sandia Remote Sensing Magazine (5) Protecting the Ozone Layer: Lessons, Models, and Prospects: by John D. Reid