Download
1 / 1
10 likes | 250 Vues
This research is funded by U.S.EPA – Science To Achieve Results (STAR) Program Cooperative Agreement. # CR - 829095. Review of Geostatistics in Aquatic Systems Joshua French and Scott Urquhart Department of Statistics, Colorado State University Fort Collins, Colorado.

E N D
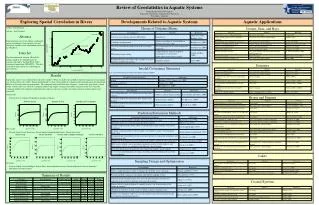
This research is funded by U.S.EPA – Science To Achieve Results (STAR) Program Cooperative Agreement # CR - 829095 Review of Geostatistics in Aquatic Systems Joshua French and Scott Urquhart Department of Statistics, Colorado State University Fort Collins, Colorado Exploring Spatial Correlation in Rivers Developments Related to Aquatic Systems Aquatic Applications Choice of Distance Metric Oceans, Seas, and Bays Author: Joshua French Advisor: Scott Urquhart Abstract Semivariograms are used to explore and quantify spatial correlation of several particle size and biological variables for the longitudinal profile of the Ohio River Data Set The data consisted of between 190 and 235 unique sampling sites (depending on the variable) collected by the Ohio River Valley Sanitation Commission (ORSANCO). The data consisted of both particle size and biological measurements. 977.5 miles along river Estuaries Invalid Covariance Structures Use of in-water distance leads to invalid covariance models: • Results • Exploratory analysis was conducted for each of the variables. When reasonable, the method of moments empirical semivariogram was calculated for each variable. Maximum likelihood was then used to model the empirical semivariogram using the exponential, Matern, or Gaussian semivariogram models. The variogram analysis fell into three categories: good results, poor results, and no results. Good results were when the variogram model fit the sample variogram reasonably well, poor results were when the variogram model fit the empirical variogram poorly, and no results were variables for which variogram analysis did not seem reasonable. • Good results: • Percent Gravel, Number of Individuals, Number of Species • Poor results • Percent Sand, Percent Detritivore, Pecent Simple Lithophilic Individuals, Percent Invertivore • No results: • Percent Cobble, Percent Hardpan, Percent Fines, Percent Boulder, Percent Tolerant Individuals, Percent Nonnative Individuals, Percent Piscivore Rivers and Streams Prediction/Estimation Methods Lakes Sampling Design and Optimization Summary of Results Coastal Systems