Download
1 / 26
260 likes | 290 Vues
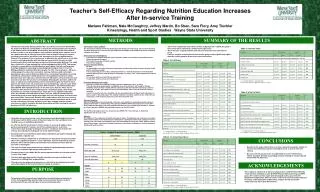
This report summarizes the results of the 2014 employee engagement survey, providing benchmarks and comparisons for your unit. Understand the data, identify strengths, opportunities, and key metrics, and plan actions for improvement.

E N D
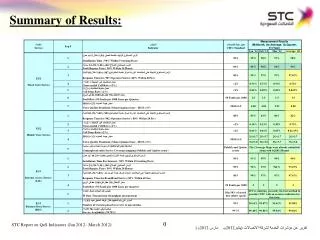
Summary of Results 11602_DESIGN - Admin/Aca Res_STAFF 1
Survey Scales & Benchmarks 2014 Total University 2014 Total College/Unit 2013 Same Unit Results 2014 Total Campus SAMPLE • Percentage Favorable Scale • Favorable: “Strongly Agree” + “Agree” and “Very Good” + “Good” • Neutral : “Neither Agree nor Disagree” • Unfavorable: “Strongly Disagree” + “Disagree” and “Very Poor” + “Poor” Benchmarks • 2013 Same Unit Results:Results from this same unit in 2013 • 2014 Total University: Currentresults across all campuses • 2014 Total Campus: Currentresults for your campus only • 2014 Total College/Unit: Currentresults for your college/unit only Percentage Favorable Difference Scale Comparison to benchmarks are expressed as percentage-point differences in percentage favorable scores for the same year (2014): • “+” shows that your score is above the benchmark • “-” shows your score falls below the benchmark • Dashes (“—”) show a comparison is not possible 5
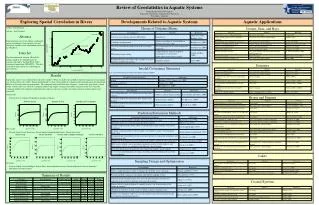
Understanding Your Results • Review the percentage favorable bar chart using this quick guide to help assess and prioritize action. • Consider the size of the group (“Valid N” column) in terms of the practical significance of the percentage favorable differences. • Compare the proportion of neutral and unfavorable responses for more insight: • A higher proportion of “neutral” than “unfavorable” can be an opportunity to shift employee opinion • A higher percentage of “unfavorable” than “neutral” may indicate action is needed The question number from the survey SAMPLE 6
Understanding Your Results, cont’d • Results include percentage of favorable responses compared to department-specific 2013 data (when available), as well as 2014 total University, campus and college/unit benchmark data. • Percentage favorable differences between 2013 and 2014 are unit-specific and may indicate areas of change in a more favorable or unfavorable direction. • Use the quick guide (right) to assess the range of change between 2013 and 2014. • More information is available in the Guide. SAMPLE 7
Summary of Engagement <Chart content=SOE> 8
Key Strengths • Areas in which your work group is currently most successful. <Chart content=Strengths> 9
Key Opportunities • Areas offering the greatest room for improvement. <Chart content=Opps> 10
Results for Key Metric: Commitment and Dedication • Focus: Motivating employee dedication and commitment to excellence. Consists of results from the following survey questions: <Chart content=CAD> 11
Key Metric: Commitment and Dedication Clear & Promising Direction • Focus:Connecting employees to college/unit strategy and goals <Chart content=CAPD> 12
Key Metric: Commitment and Dedication Commitment to Excellence • Focus:Encouraging high-quality education, research, and services <Chart content=CTE> 13
Key Metric: Commitment and Dedication Confidence in Leaders • Focus:Inspiring trust through open communications and leadership support <Chart content=CIL> 14
Key Metric: Commitment and Dedication Development Opportunities • Focus:Supporting employees in developing and achieving career objectives <Chart content=DO> 15
Key Metric: Commitment and Dedication Respect & Recognition • Focus:Valuing employees and acknowledging their contributions <Chart content=RAR> 16
Results for Key Metric: Effective Environment • Focus: Supporting employees’ success with the tools and resources of an effective work environment. Consists of results from the following survey questions: <Chart content=EE> 17
Key Metric: Effective Environment Authority & Empowerment • Focus:Encouraging employee autonomy and innovation to improve work <Chart content=AAE> 18
Key Metric: Effective Environment Clear Expectations and Feedback • Focus:Clarifying performance expectations and providing regular feedback <Chart content=CEAF> 19
Key Metric: Effective Environment Collaboration • Focus:Supporting cooperation and sharing of ideas within and across work groups <Chart content=C> 20
Key Metric: Effective Environment Support and Resources • Focus:Ensuring that employees have the skills, information and resources to do their job well <Chart content=SAR> 21
Key Metric: Effective Environment Work, Structure, & Process • Focus:Promoting innovation and equitable distribution of workload <Chart content=WSAP> 22
Survey Follow-Up <Chart content=SF> 23
Helpful Tools & Resources *Leaders will receive a report, and access to the Insight2Action website, if they have 10 faculty or 10 staff members who completed the 2014 surveys. 26