Elaboration and Direct Relationships
440 likes | 905 Vues
Elaboration and Direct Relationships. Elaboration of Bivariate Tables: A Direct Relationship. Creating the Crosstabulated Table - 1. In SPSS, you can obtain a crosstabulated table by clicking: Analyze > Descriptive Statistics > Crosstabs

Elaboration and Direct Relationships
E N D
Presentation Transcript
Creating the Crosstabulated Table - 1 In SPSS, you can obtain a crosstabulated table by clicking: Analyze > Descriptive Statistics > Crosstabs In other words, first, click on Analyze in the menu bar of SPSS, then find and click on Descriptive Statistics on a pop-down submenu. Again, find and click on Crosstabs on another pop-down submenu. Then, you will see a window shown in the next slide.
Creating the Crosstabulated Table - 2 Move the variable [owngun] to the “Rows(s):” list box. Move the variable [conserv] to the “Columns(s):” list box. Click on “Cells…” button on the bottom.
Creating the Crosstabulated Table - 3 Mark the Column check box in the Percentages panel. Click on the Continue button to close the dialog box.
Creating the Crosstabulated Table - 4 Click on the OK button to produce the output.
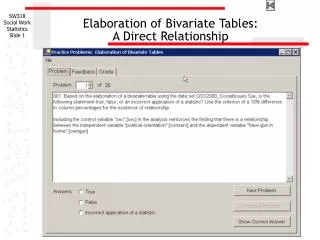
The Bivariate Table There is a relationship in the bivariate table if the absolute value of the difference in column percentages on one of the rows is 10% or greater. In this example, the difference is 57.6% - 73.1% = -15.5%. There is a relationship.
Adding the control variable to the analysis - 1 To add the control variable to the analysis, click on the Dialog Recall tool button and select the Crosstabs command from the pop-up menu.
Adding the control variable to the analysis - 2 To add the control variable to the analysis, move the [sex] variable to the list box in the Layer panel. Click on the OK button to produce the output.
The Partial Tables in the Crosstabulated Output The partial table for the first value or condition of the control variable (sex = male) is in the top half of the three-way crosstabs table. The partial table for the second value or condition of the control variable (sex = female) is in the bottom half of the three-way crosstabs table.
The First Partial Table There is a relationship in the first partial table if the absolute value of the difference in column percentages is 10% or greater for the same row we compared in the bivariate table. In this example, the difference is 55.2% - 71.2% = -16.0%. There is a relationship in the first partial table.
The Second Partial Table There is a relationship in the second partial table if the absolute value of the difference in column percentages is 10% or greater for the same row we compared in the bivariate table. In this example, the difference is 60.0% - 74.6% = -14.6%. There is a relationship in the second partial table.
Differences in Column Percentages - 1 To compare column percentages, we compute the difference between the lower left-hand cell in the partial tables and the bivariate table The percentage in both the first partial table (71.2%) and the second partial table (74.6%) are LESS than 5% different from the bivariate table (73.1%).
Differences in Column Percentages - 2 To compare column percentages, we compute the difference between the lower right-hand cell in the partial tables and the bivariate table The percentage in both the first partial table (55.2%) and the second partial table (60.0%) are LESS than 5% different from the bivariate table (57.6%).
Elaboration of Bivariate Tables:A Direct Relationship With the information about the relationships in the partial tables and differences in column percentages, we can answer the question.
Elaboration of Bivariate Tables:Detecting a Spurious Relationship
Creating the Crosstabulated Table - 1 In SPSS, you can obtain a crosstabulated table by clicking: Analyze > Descriptive Statistics > Crosstabs In other words, first, click on Analyze in the menu bar of SPSS, then find and click on Descriptive Statistics on a pop-down submenu. Again, find and click on Crosstabs on another pop-down submenu. Then, you will see a window shown in the next slide.
Creating the Crosstabulated Table - 2 Move the variable [prayer] to the “Rows(s):” list box. Move the variable [minorty] to the “Columns(s):” list box. Click on “Cells…” button on the bottom.
Creating the Crosstabulated Table - 3 Mark the Column check box in the Percentages panel. Click on the Continue button to close the dialog box.
Creating the Crosstabulated Table - 4 Click on the OK button to produce the output.
The Bivariate Table There is a relationship in the bivariate table if the absolute value of the difference in column percentages on one of the rows is 10% or greater. In this example, the difference is 24.0% - 38.5% = -14.5%. There is a relationship.
Adding the control variable to the analysis - 1 To add the control variable to the analysis, click on the Dialog Recall tool button and select the Crosstabs command from the pop-up menu.
Adding the control variable to the analysis - 2 To add the control variable to the analysis, move the [fundamen] variable to the list box in the Layer panel. Click on the OK button to produce the output.
The Partial Tables in the Crosstabulated Output The partial table for the first value or condition of the control variable (religious orientation = not fundamentalist) is in the top half of the three-way crosstabs table. The partial table for the second value or condition of the control variable (religious orientation = fundamentalist) is in the bottom half of the three-way crosstabs table.
The First Partial Table There is not a relationship in the first partial table since the difference of 42.9% - 41.0% = 1.9% is less than 10%.
The Second Partial Table There is not a relationship in the second partial table since the difference of 21.4% - 25.9% = -4.5% is less than 10%.
Elaboration of Bivariate Tables:Detecting a Spurious Relationship With the information about the relationships in the partial tables and the bivariate table, we can answer the question.
Elaboration of Bivariate Tables:Detecting a Conditional Relationship
Creating the Crosstabulated Table - 1 In SPSS, you can obtain a crosstabulated table by clicking: Analyze > Descriptive Statistics > Crosstabs In other words, first, click on Analyze in the menu bar of SPSS, then find and click on Descriptive Statistics on a pop-down submenu. Again, find and click on Crosstabs on another pop-down submenu. Then, you will see a window shown in the next slide.
Creating the Crosstabulated Table - 2 Move the variable [absingle] to the “Rows(s):” list box. Move the variable [fundamen] to the “Columns(s):” list box. Click on “Cells…” button on the bottom.
Creating the Crosstabulated Table - 3 Mark the Column check box in the Percentages panel. Click on the Continue button to close the dialog box.
Creating the Crosstabulated Table - 4 Click on the OK button to produce the output.
The Bivariate Table There is a relationship in the bivariate table if the absolute value of the difference in column percentages on one of the rows is 10% or greater. In this example, the difference is 40.8 - 51.2% = -10.4%.There is a relationship.
Adding the control variable to the analysis - 1 To add the control variable to the analysis, click on the Dialog Recall tool button and select the Crosstabs command from the pop-up menu.
Adding the control variable to the analysis - 2 To add the control variable to the analysis, move the [conserv] variable to the list box in the Layer panel. Click on the OK button to produce the output.
The Partial Tables in the Crosstabulated Output The partial table for the first value or condition of the control variable (political orientation = not conservative) is in the top half of the three-way crosstabs table. The partial table for the second value or condition of the control variable (political orientation = conservative) is in the bottom half of the three-way crosstabs table.
Differences in Column Percentages - 1 To compare column percentages, we compute the difference between the lower left-hand cell in the partial tables and the bivariate table Comparing percentages in the lower left-hand cell of the tables, the percentage in both the first partial table (57.1%) and the second partial table (36.4%) are MORE than 5% different from the bivariate table (51.2%).
Differences in Column Percentages - 2 To compare column percentages, we compute the difference between the lower left-hand cell in the partial tables and the bivariate table Comparing percentages in the lower right-hand cell of the tables, the percentage in both the first partial table (65.2%) and the second partial table (17.4%) are MORE than 5% different from the bivariate table (40.8%).
Elaboration of Bivariate Tables:Detecting a Conditional Relationship With the information about the percentage differences in the partial tables and the bivariate table, we can answer the question.
Steps in solving elaboration problems - 1 Question: elaboration of bivariate table reinforces the finding of a relationship (a direct relationship)? Is there a relationship between independent and dependent variables? No False Yes Are there relationships in both partial tables? No False Yes Are the differences in percentages less than 5%? No False Yes True
Steps in solving elaboration problems - 2 Question: elaboration of bivariate table negates the finding of a relationship (a spurious or intervening relationship)? Is there a relationship between independent and dependent variables? No False Yes Are there relationships in both partial tables? No False Yes True
Steps in solving elaboration problems - 3 Question: elaboration of bivariate table alters the interpretation of a relationship (a conditional relationship)? Is there a relationship between independent and dependent variables? No False Yes Are the differences in percentages 5% or more? No False Yes True