Download

1 / 13
130 likes | 247 Vues
This guide explains the concept of direct and inverse relationships in mathematics. A direct relationship occurs when one variable increases, and another variable also increases proportionally, represented graphically by a straight line with a high correlation (greater than 0.95). In contrast, an inverse relationship is characterized by a downward-sloping curve, where one variable increases as the other decreases, showing a proportional decrease. Examples and equations illustrate how to identify and validate these relationships.

E N D
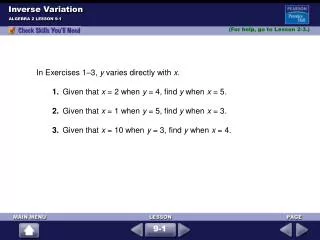
Direct Relationships In a direct relationship, as “x” increases “y” increases proportionally. On the graph you see a straight line.
What is Straight? Logger Pro provides a linear fit that shows the properties of your line in the form of y = mx + b. • A perfect line has a correlation of 1.00 • Random dots would have a correlation of 0. • Our criteria for a line straight enough for the relationship to be called direct is a correlation > 0.95
Direct Equations Logger Pro provides a linear fit that shows the properties of a direct relationship. From this you can write an equation for the line: Temp=(2.00)time + 12
Test the Equation T= 2t + 12 From the equation, if 5 minutes have gone by the temperature should be: T = 2(5) + 12 = 22 °C From the graph, a time of 5 minutes matches a temperature of 22 °C. √
Express the Equation The slope tells us that the temperature is increasing 2.00 °C every minute. “Temperature increases proportionally with time, rising 2.00 °C per minute.”
Inverse Relationships You can suspect a relationship may be inverse when you see a down sloping curve like this one.
Inverse Relationship: PROOF Evidence for an inverse relationship comes from calculating the inverse of the “x” axis and plotting it against y. If the relationship IS inverse then this plot will give a straight line (correlation > 0.95).
Inverse Equation You now have a straight line. PLUG IN: P = 15(1/t) + 0 Note that “b” is approximated as zero. P t = 15 This is the common form of inverse relationships: “xy=k”.
Test the Inverse From the graph, at 25 sec. the pressure was about 0.6 atm. P t = 15 Using the equation: P (25 sec) =15 P = 15/25 = 0.60 atm √
Express the Inverse “Pressure decreases over time in an inverse relationship.” BEWARE: “Pressure decreases proportionally (or directly) over time” would be a false statement. It would represent data that looked like this.
Beware lookalikes! The graph at left looks like the down sloping curve of an inverse relationship. BUT when the inverse of time (1/x) is plotted, the result is NOT a straight line. These data fail the test.
ReviewDirect Inverse • as “x” increases, “y” increases proportionally • y=kx (or y=kx+b) • “x” vx. “y” plots as a straight line with correlation > 0.95 • as “x” increases, “y” decreases proportionally • xy = k • “1/x” vs. “y” plots as a straight line with correlation > 0.95