Predictive Modeling & Marketing
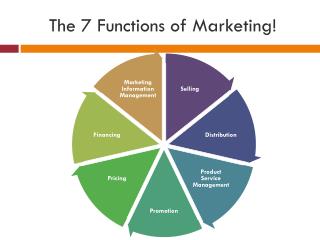
Predictive Modeling & Marketing. Overview. A quick peek at what Marketing says it does “wallet share” Risk scoring Aligning marketing and UW. Producer Segmentation Market Planning Revenue Forecasting Cross sell and Up sell Retention and Profitability. Sales and Distribution.


Predictive Modeling & Marketing
E N D
Presentation Transcript
Predictive Modeling & Marketing ISO Confidential Material
Overview • A quick peek at what Marketing says it does • “wallet share” • Risk scoring • Aligning marketing and UW
Producer Segmentation Market Planning Revenue Forecasting Cross sell and Up sell Retention and Profitability Sales and Distribution Underwriting Claims Risk Selection and Pricing Portfolio Management Premium Adequacy Billing and Collections Management Payment Accuracy Claim Collaboration > Fraud Detection > Subrogation > Risk Transfer > 3rd Party Deductible > Reinsurance Recoverable General Organizational Overview An information business focused on risk taking. Make. Sell. Serve.
Family needs Car insurance Travel Mortgage Student Customer Focus: Products across life stages $ over time Expenditure Income SVP Life Umbrella Coverage At School Coverage Out of country Auto Insurance Home As income increases, the needs for insurance grow
Stackable Coverage can show ‘wallet share’ of customers and point out opportunities for cross-sell and up-sell $1.3 million $1 million Personal Umbrella $300K $300K $100K $50K $250 $250 $250 Personal Auto Policy Homeowners
Customer Life Cycle Management Best Practice use of CLTV is to incorporate it into all stages during a customer’s lifecycle Prospect Responder Current Customers Former • Cross-sell Campaigns • Upsell Campaigns Most Profitable Voluntarily Left You Target Market Responder New Customer Next Most Profitable NOT Profitable Forced Churn • Segmentation • Risk Selection • Pricing • Yield Management • Attrition Prediction • Forced Cancellation • Winback Campaigns • Acquisition Campaigns
Case Study: Database MarketingImplementation Approach SERVICE DIFFERENTIATION BASED ON “PORTFOLIO POSITION” Most Profitable Retention Programs Cross-sell / Up-sell Next Most Profitable Loss Control Services Agency Contact Re-underwriting Cross-sell / Up-sell NOT Profitable Forced Churn (where legally appropriate) Price to Risk
A vast array of CRM applications demand a common glue -- Analytics
Sales Funnel Process Universe of all Prospects Lead Gathering and Targeting Your Selected Prospects Cold Lead Warm Lead Qualification Hot Sales Pipeline Opportunity Selling, Contracting Customer Analyze, learn, grow customer
General Advertising and Direct Mail – A Simple Comparison Advertising Direct Marketing • Mass • Targeted • Competitive Attention • Selective Attention • Breadth • Depth • Remember • Respond • Impression • Decision • Pay for Everyone • Pay for Targets
Selection Factors • Business Lists • SIC (Standard Industrial Classification) • Employee Size • Annual Sales/Revenue • Title • Any other information captured on subscription form (publications) • Corporate linkage information • # of years in business • Geographical (zip, SCF, county, state) • Credit information • Consumer Lists • Age • Income • Gender • Marital Status • Homeowner • Dwelling Type (home or apartment) • Mail order buying (by product type) • Interests • Presence of children • Geographical (zip, SCF, county, state, carrier route)
B2B Marketing Profile – Banking, Finance & Insurance Base: N= 47 Source: Forrester Consulting Survey for ABM
Data Driven Campaign Management New New New Cross Services Product Channels sell Data Driven Campaign management Retention& Loyality Credit Risk Targeted Marketing Data Market Segmentation & Scoring OLAP Reporting Mining Research Analysis Data Analysis Data Warehouse
Personal Auto Risk Framework Input Rating Plan State State Environmental Risk Module: Weather, Street, Businesses, Traffic Density, Driving Patterns etc Territory Address Vehicle Age & Symbol VIN Vehicle Risk Module: Weight, Engine Size, etc. Class Driver History Module Personal Identifiers Limits & Deductibles No Change Special Adjustments No Change Address, Drivers, Vehicles Policy Risk Module Interactions of all Variables
ZIP Code 94109: A Tour Fishermen’s Wharf The Tenderloin: "...the haunt of the low and vile of every kind. ….Licentiousness, debauchery, pollution, loathsome disease, insanity from dissipation, misery, poverty, blasphemy and death are there. And Hell, yawning to receive the putrid mass, is there also. “ Robert Louis Stevenson declared "Nob Hill, the Hill of Palaces, must certainly be counted the best part of San Francisco." Japantown
Competitive Advantage • Carriers establish a base rate for each rating territory that represents the average expected loss cost. Base Rate Loss $ Risk
Competitive Advantage • Carriers establish a base rate for each rating territory that represents the average expected loss cost. • In reality there is a distribution of risk and expected loss costs, even within a territory. Actual Costs Base Rate Loss $ Risk
Competitive Advantage • Carriers establish a base rate for each rating territory that represents the average expected loss cost. • In reality there is a distribution of risk and expected loss costs, even within a territory. • The Prescreen Score more closely follows the actual distribution of risk. Actual Costs Prescreen Score Base Rate Loss $ Risk
Competitive Advantage • Carriers establish a base rate for each rating territory that represents the average expected loss cost. • In reality there is a distribution of risk and expected loss costs, even within a territory. • The Prescreen Score more closely follows the actual distribution of risk. Actual Costs Prescreen Score Base Rate Loss $ Risk Users of Prescreen can let their competitors waste resources chasing these marginal accounts!
Summary • Marketers can use sophisticated models • Portfolio Management is a key to success • Risk-based pricing helps a lot • It is not a competitive advantage if you don’t use it