How To Using SQL With Tableau For Powerful Data Visualization.
In the end, SQL and Tableau are not just tools; they are a powerful team that makes data analysis faster, smarter, and more insightful. SQL does the meticulous, foundational work of the craftsman, while Tableau brings the creative, visual brilliance of the architect. By mastering this collaborative process, you gain the ability to turn raw information into golden insights, allowing you to build and present a compelling data story that everyone can understand.


How To Using SQL With Tableau For Powerful Data Visualization.
E N D
Presentation Transcript
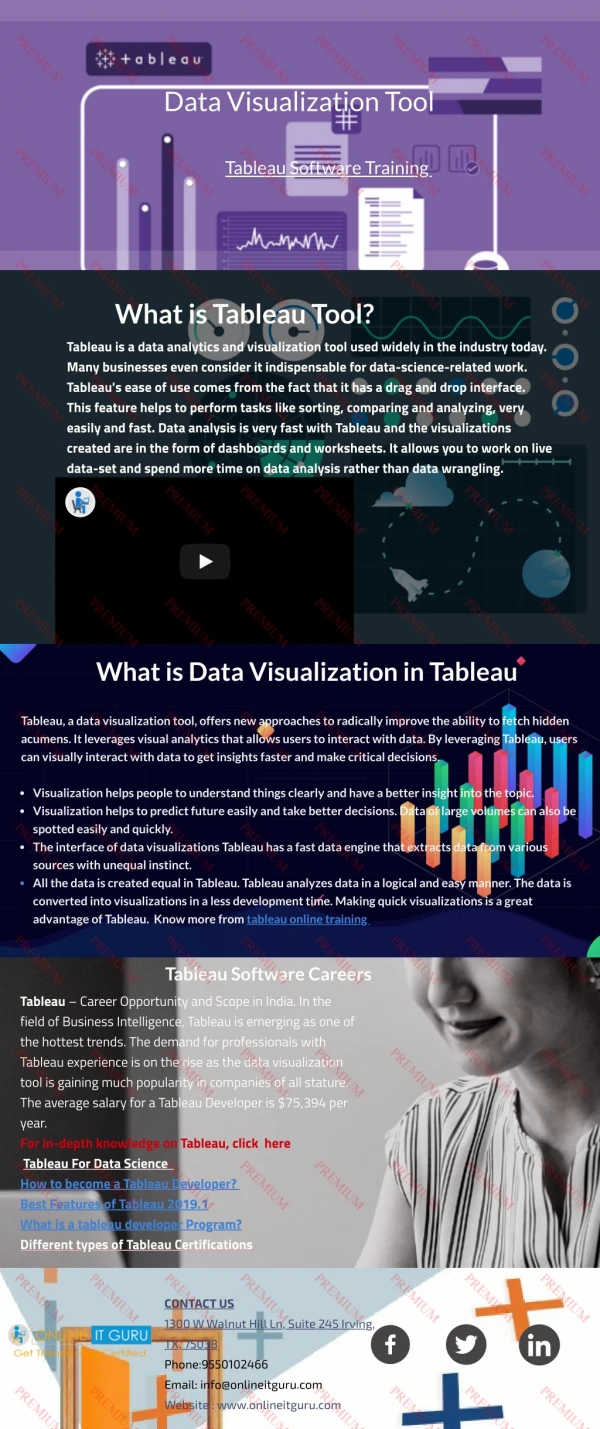
1 Ultimately, Tableau and SQL are a potent combination that enhances the speed, intelligence, and insight of data analysis; they are more than just tools. Tableau contributes the imaginative, visual genius of the architect, while SQL handles the methodical, fundamental work of the craftsman. Gaining proficiency in this cooperative process enables you to transform unprocessed data into insightful knowledge that can be used to create and communicate an engaging data narrative that is easy for everyone to comprehend. The Master Craftsman: The Indispensable Role of SQL Before any beautiful building can be erected, the materials must be prepared with care and precision. This is the indispensable role of SQL, or Structured Query Language. SQL is the universal language for talking to databases. It's the master craftsman's toolkit, used to access, filter, and shape raw data into a clean, usable form. The Blueprint of Data: Raw data is often scattered across multiple tables in a database, making it hard to work with. SQL allows you to create a perfect blueprint for your data by bringing everything together. Using commands like JOIN, you can connect different tables and create a single, unified dataset that tells a complete story. For example, you can combine a list of customer purchases with their demographic information, all with one simple query. The Workshop:SQL is where all the hard, messy work of data preparation happens. It’s a workshop where the raw materials are polished. You can use SQL to: oClean Up Messes: Find and fix errors, remove duplicate entries, and deal with missing values. This step is crucial, as a "dirty" dataset will lead to flawed visualizations. oFilter What You Don't Need: Only want to see sales from the last year? A simple WHERE clause can filter out everything else, leaving you with only the information you need. This saves time and makes your visualizations run faster. oAggregate for Clarity: Instead of working with millions of individual sales records, you can use SQL to GROUP BY a category, like a product or a month, and find a total. This provides the summary-level data that is perfect for visualization.
2 The Expert Architect: The Brilliance of Tableau Once the craftsman has prepared the materials, the architect can begin their work. Tableau is the world-class tool for data visualization. It takes the clean, structured data provided by SQL and transforms it into stunning, interactive, and easy-to-understand visual dashboards. Designing Insights:Tableau’s genius lies in its simplicity. With a friendly "drag and drop" interface, anyone can create beautiful charts, graphs, and maps without writing a single line of code. You can visually explore your data, asking questions and instantly seeing the answers appear on your screen. This frees you from the tedious work of design and lets you focus on finding powerful insights. The Power of Connection: Tableau seamlessly connects to a wide variety of data sources, including the results of your SQL queries. This direct connection ensures that the data you're visualizing is always fresh and accurate. The architect's blueprint is always up-to-date with the craftsman's latest work. A Story in Visuals: Tableau helps you tell a compelling story with your data. A complex sales report with thousands of numbers is impossible to digest. But a dynamic dashboard that shows sales trends by region, product type, and time period, all on one screen, is a powerful tool for a business leader. This ability to make data speak is why Tableau is a favorite tool of professionals everywhere. The Collaborative Build: How They Work Together The true magic happens when SQL and Tableau are used as a team. They are not competing tools but complementary partners in the modern data workflow. Step 1: The Blueprint (SQL): A data analyst starts by writing a custom SQL query. This query acts as the blueprint, defining exactly what data is needed from the database, how it should be cleaned, and how it should be aggregated. Step 2: The Foundation (Tableau's Data Source): The analyst then opens Tableau and connects it directly to the database using their custom SQL query. Tableau "reads" the query and uses the clean, refined data as the foundation for all subsequent visualizations. Step 3: The Build (Tableau Visualizations): With the data flowing smoothly, the analyst begins the work of the architect. They use Tableau's powerful interface to design charts, create interactive filters, and build a cohesive dashboard that tells a clear, insightful story. This elegant workflow separates the data preparation from the visualization, ensuring that each step is done with the right tool for the job.
3 The Path to Mastery The demand for professionals who can use both SQL and Tableau is at an all-time high. Companies in every industry are looking for people who can not only work with data but also transform it into a strategic asset. For those ready to master this powerful partnership, a structured learning path is a fantastic investment. A quality Data Analytics Training institute in Noida offers comprehensive programs that cover the fundamentals of both SQL and Tableau, providing hands-on experience that mirrors real-world projects. Such practical education is available in major hubs like Kanpur, Ludhiana, Moradabad, and Delhi, and across all cities in India, ensuring that aspiring analysts have access to the resources they need to succeed in the data world. Conclusion In the end, SQL and Tableau are not just tools; they are a powerful team that makes data analysis faster, smarter, and more insightful. SQL does the meticulous, foundational work of the craftsman, while Tableau brings the creative, visual brilliance of the architect. By mastering this collaborative process, you gain the ability to turn raw information into golden insights, allowing you to build and present a compelling data story that everyone can understand.