Download
1 / 2
20 likes | 47 Vues
Info-graphics take very less time of users and in exchange provides all the information in an entertaining way. check here how interactive infographics are enhancing online marketing strategies.

E N D
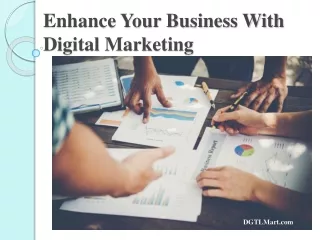
How To Enhance Digital Marketing With Interactive Data Visualization There are many marketing techniques which are very loud and annoying. This is noticed that users simply ignore these techniques when marketers come to them with it. Interactive data visualization is the technique in Digital Marketing which is new and very exciting for the users. Info-graphics is an example of data visualization. Info-graphics are made of some text and visuals. Info-graphics take very less time of users and in exchange provides all the information in an entertaining way. These new visualization also called as webgraphics. To create this one require time and resources to provide an interactive experience for the users. This will eventually drive more traffic and conversions to site. Let’s check here how interactive infographics are enhancing online marketing strategies. A Break from Data Dump- The purpose of infographics is to serve the information to the users in simple and easy to understand way. 2-D infographics are good work well, however in the event that you have a great deal of information to share inside a single visual, the outcome is an unstructured information dump that isn’t useful for the users. Data Becomes Engaging- With the help of animations and clever transitions, users can learn according to their convenience in an entertaining way.Interactive infographics are those in which users can find out the data easily they needed by navigating the data.
Traditional infographics a ahead as the most engaging way of information sharing but now a days users are already ready to move to the next level with animations, clickable links, and relevant information they can easily connect with. More Shareable Content- On social media platform, interactive data visualization have more importance than data visualization. The main goal of SEO is content creation and to make sure that this content should be sharable and reach more and more people. Interactive infographics are proved to be more sharable and gets more clicks, it draws attention to your URL which can later be used to turn your visitors on to conversions. Increases Visiting Time on Site- The important part of SEO best practices is motivating users to visit your page for longer than a couple of seconds. Google algorithm keep notes of how much time an user spent on particular page. It considers as a page haven’t any information user looking for, if an user exist from page within 20 seconds. This will be harmful for your website ranking. Interactive info-graphics are useful to keep engage to the user on a page. It takes time to look at Interactive info-graphics than normal info-graphics. They are also very entertaining, interesting and information given, so user spent more time than usual. Related Tags: Internet marketing Singapore Social Media Content Strategy