Mean fluorescence intensity
Negative control. E-cadherin. KM12C shRNA SCRAMBLE. KM12C shRNA CDH17. 10 1. 10 1. 10 1. 10 1. 10 2. 10 2. 10 2. 10 2. 0. 0. 0. 0. 10 3. 10 3. 10 3. 10 3. 10 4. 10 4. 10 4. 10 4. Cell number. Cell number. Mean fluorescence intensity. Mean fluorescence intensity.

Mean fluorescence intensity
E N D
Presentation Transcript
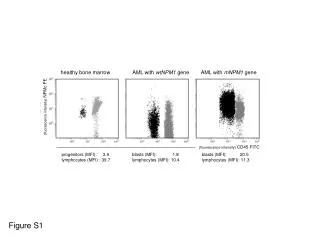
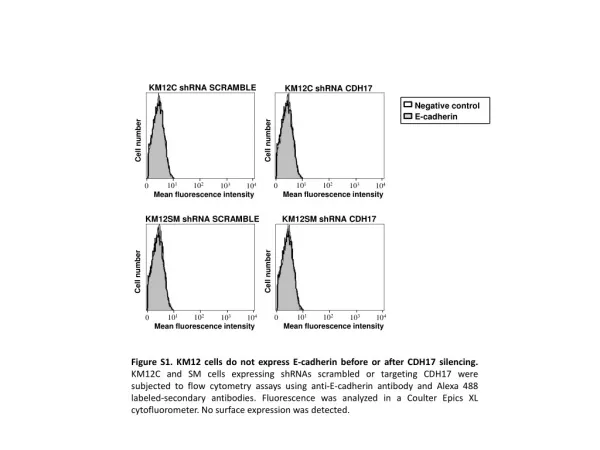
Negative control E-cadherin KM12C shRNA SCRAMBLE KM12C shRNA CDH17 101 101 101 101 102 102 102 102 0 0 0 0 103 103 103 103 104 104 104 104 Cell number Cell number Mean fluorescence intensity Mean fluorescence intensity Mean fluorescence intensity Mean fluorescence intensity KM12SM shRNA SCRAMBLE KM12SM shRNA CDH17 Cell number Cell number Figure S1. KM12 cells do not express E-cadherin before or after CDH17 silencing. KM12C and SM cells expressing shRNAs scrambled or targeting CDH17 were subjected to flow cytometry assays using anti-E-cadherin antibody and Alexa 488 labeled-secondary antibodies. Fluorescence was analyzed in a Coulter Epics XL cytofluorometer. No surface expression was detected.
A B Invasive cells Cell migration speed (μm/h) KM12C KM12SM KM12C KM12SM KM12C KM12SM KM12C KM12SM shRNA CDH17 #60 shRNA CDH17 #60 shRNA SCRAMBLE shRNA SCRAMBLE Figure S2. Silencing of CDH17 does not modify KM12 cell migration and invasion. A) KM12 cell lines were cultured to confluence in Matrigel-coated plates (0.4 μm/mm²), and a 1 mm-wide wound was done across the monolayer. Migration speed of the cells was calculated from the distance covered after scratching in two days, as quantified in the pictures taken immediately or 48h after the scratching, divided by 48 (number of hours) and by 2 (because cells advanced in two fronts) . B) Invasion across Matrigel of the indicated KM12 cell lines towards serum. After 48 h of incubation, non-invading cells were removed and invasive cells were fixed, stained and counted under a microscope. In both experiments, data represent the mean + SD of 2 independent experiments.
CDH17 CDH17 Control Control CDH17 Control siRNA: CDH17 RhoGDI Caco2 SW480 SW620 Figure S3. Assessment of silencing of CDH17 in Caco2, SW480 and SW620 cells. These cell lines were transfected with siRNAs against CDH17, or with control siRNAs. After 48h, cells were lysed, extracts were resolved by SDS-PAGE gels and subjected to Western blot analysis to detect CDH17. RhoGDI was used as loading control.
104 104 104 101 101 101 101 101 101 102 102 102 102 102 102 104 0 0 0 0 0 0 103 103 103 103 103 103 104 104 104 102 103 0 101 KM12C shRNA SCRAMBLE KM12C shRNA CDH17 #60 KM12SM shRNA SCRAMBLE KM12SM shRNA CDH17 #60 Negative Control Negative Control α2-integrin β1-integrin Cell number 4.4 4.4 7.1 6.9 101 103 104 0 102 Mean fluorescence intensity KM12C shRNA SCRAMBLE KM12C shRNA CDH17 #60 KM12SM shRNA SCRAMBLE KM12SM shRNA CDH17 #60 Cell number Figure S4. Silencing of CDH17 does not alter α2β1 integrin expression on KM12 cell surface. KM12 cell lines were detached with 2 mM EDTA in PBS and incubated with antibodies against α2 or β1 integrin subunits or with control antibodies. After washing, cells were incubated with secondary antibodies labeled with FITC. Cells were analyzed in a cell fluorometer to assess cell surface expression of afore mentioned integrin subunits. 10.1 12.5 12.1 10.6 Mean fluorescence intensity
KM12SM shRNA SCRAMBLE KM12SM shRNA CDH17 KM12C shRNA SCRAMBLE KM12C shRNA CDH17 pY229-p120 catenin p120 catenin β-catenin RhoGDI Figure S5. Expression of β-catenin and p120-catenin is not altered after CDH17-silencing. KM12 cell lines were lysed, protein extracts were resolved by SDS-PAGE and analyzed by western blot to assess expression of β-catenin and phosphorylated p120-catenin. After stripping, membrane was reincubated with antibodies against total p120-catenin. Control loading was done with anti-RhoGDI antibodies.