Download
1 / 21
210 likes | 566 Vues
Estimate of Mercury Emission from Natural Sources in East Asia. Suraj K. Shetty 1 *, Che-Jen Lin 1 , David G. Streets 2 , Carey Jang 3 , Thomas C. Ho 1 and Hsing-wei Chu 1 , Taruna Vanjani 1 1 College of Engineering, Lamar University, Beaumont, TX

E N D
Estimate of Mercury Emission from Natural Sources in East Asia Suraj K. Shetty1*, Che-Jen Lin1, David G. Streets2, Carey Jang3, Thomas C. Ho1 and Hsing-wei Chu1 , Taruna Vanjani1 1College of Engineering, Lamar University, Beaumont, TX 2Decision and Information Sciences Division, Argonne National Laboratory, Argonne, IL 3Office of Air Quality Planning and Standards, USEPA, Research Triangle Park, NC 2007 CMAS Conference Session 4: Emissions Inventories, Modeling and AnalysisOctober 2, 2007, Chapel Hill, NC
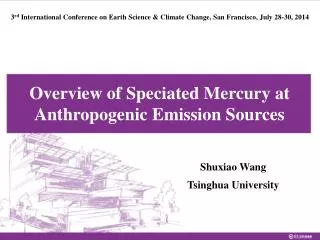
Mercury Emissions Anthropogenic sources • Coal-fired power plants, • Mining and industrial metal processing • Chloro-alkali production, waste incineration Natural sources / re-emission • Volcanic eruptions, degassing, biomass burning • Emissions from vegetation, soil and water surfaces • caused by past mercury emission and deposition from both natural and anthropogenic sources • Photochemical reduction, biotic and abiotic processes
Issues of Mercury Emissions • Anthropogenic Hg emission is speciated and well documented …. 2200 Mg/yr [Pacyna et al., 2006] • Natural Hg emission was either assumed to be balanced by GEM deposition, or a fraction (30-50%) of modeled Hg deposition [Bullock & Bhreme, 2002; Seigneur et al., 2004, Lin et al., 2005] • May dominate anthropogenic emission [Lindberg et al., 1998] • 1000-4200 Mg/yr …Highly uncertain !
Natural Hg Emission Process • Diurnal and seasonal variation observed for emission from vegetation, soil and water surfaces • Strongly affected by meteorological parameters (temperature, pressure, solar radiation, etc.) • Emission flux varies according to the land cover [Lindberg et al., 1998, 2002] • GEM transpiration rate varies with species of vegetation [Obrist et al., 2004, Zhang et al., 2005] • Net flux depends on ambient Hg levels and soil Hg contents [Frescholtz et al., 2004]
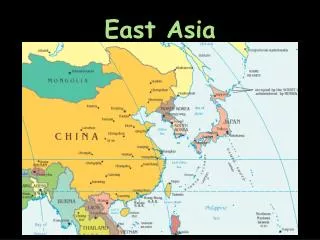
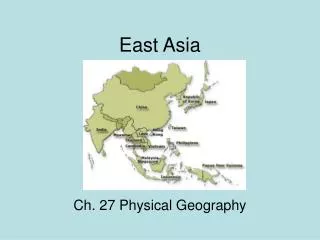
WhyEast Asia Domain ? • Recent studies have focused on the North American region [Xu et al., 1999; Lin and Tao, 2003; Bash et al, 2004; Lin et al., 2005; Gbor et al., 2006] • Asia amounts to about 54% of the global anthropogenic Hg emissions with China contributing to 50% of the Asian Emission [Seigneur et al., 2004; Pacyna et al., 2006; Streets et al., 2005] • With natural emission, total Hg emission from East Asia would be quite a considerable amount • Model uncertainties and under-predictions
Estimating Hg Emission from Natural Processes • Emission from Vegetation • Emission from Soil • Emission from Soil under the Canopy • Emission from Water
Emission from Vegetation Fe - Hg emission flux Et - Evapotranspiration rate Cs - Hg soil water concentration 1. 2. [ Xu et al., 1999 ] [ Monteith and Unsworth, 1990 ] • Rn - the net radiation • G - soil heat flux • (es - ea) - vapor pressure deficit of the air • a - mean air density at constant pressure • Cp - specific heat of the air • - slope of sat. vapor press.- temp. curve • - psychrometric constant rs - bulk surface resistance ra - aerodynamic resistance 3. [ Monteith and Unsworth, 1990 ] rl - bulk stomatal resistance LAI - Leaf Area Index
Emission from Soil Fs - Hg soil emission flux Hgs - soil mercury concentration Ts - soil temperature n, , m - constants 1. [ Gbor et al., 2006 ] 2a. Fsc – Hg soil flux under canopy Rg - solar radiation reaching ground Rgc - solar radiation under canopy Hgs - soil mercury concentration LAI – leaf area index - extinction coefficient a, b, c - constants [ Gbor et al., 2006 ] 2b. [ Monteith, 1973 ]
Emission from Water Fw - Hg water emission flux kl - mass transfer coefficient Cw - Hg concentration in water Ca - Hg concentration in air H – Henry’s law constant 1. [ Bash et al., 2004 ] 2. U – wind speed at 10 m Schg - schmidt number for Hg Scco2 - schmidt number for CO2 [ Wanninkhof et al., 1992 ] Cw = 0.04 ng/l [ Xu et al., 1999 ] Henry’s law constant = ƒ (temperature) [ Sanemasa, 1975 ] Sc = ƒ (temperature) … approach followed by Lin and Tao, 2003
97 1 1 1 164 Domain Specifications • 36-km spatial resolution, 164 x 97, 1 layer domain grid • Lambert Conformal projection centered at 34 N, 110 E • East Asia domain covers about 70 % of Asia (includes entire China region and some parts of it neighboring countries) • 2001 meteorology data from USEPA’s ICAP program
Natural Hg Emission Model Model MCIP Vegetation Hg Soil Conc. Data Soil under Canopy Landuse Data LAI Data Gridded Emission Flux Soil Water Hg Air Conc. Data* Simulation Approach * Lin et al, 2006b
Hg Soil Concentration (China) Background concentration of Hg in soils of China (from Chinese Environmental monitoring center, 1992)
Landuse data Study Domain Landuse from Global Landuse Data
LAI Data (a) (b) The 8-day average Leaf Area Index (LAI) data was obtained from MODIS satellite products: (ftp://primavera.bu.edu/pub/datasets/MODIS). The downloaded binary formats were converted into the model ready format using ENVI® (Environment for Visualizing Images), an image processing software. (a) January (b) July
Simulation and Calculations • Simulations were performed for the month of January, April, July and October 2001 • Months are representative of the seasonal meteorological variation in the domain • Calculated hourly emission fluxes were summed for the entire month in each grid to show the spatial distribution of the natural emission • Annual emissions were estimated as three times of the four-month’s sum
January April July October Diurnal Variation
Seasonal Variation January April July October
Results & Conclusions • Estimated Hg flux ranges from 0 - 66 ng m-2 hr-1 from vegetation, the flux from soil (<12 ng m-2 hr-1) and water (<5 ng m-2 hr-1) is much smaller • Total emission from domain is 830 Mg yr-1, the emission from China is about 460 Mg yr-1 • Natural Hg emission accounted to about 50-55% of the total Hg emissions for the year 2001 • Emission exhibits diurnal variation and strongly depends on temperature, radiation, vegetation coverage and mercury concentrations in soils • Higher emission occur in the south due to denser vegetation coverage and higher Hg soil concentrations • Natural Hg emission can dominate anthropogenic source in summer
Acknowledgements • Texas Commission on Environmental Quality (TCEQ Work Order Number: 64582-06-15) • The USEPA Office of Air Quality Planning & Standards (RTI Subcontract Number: 6-321-0210288) • Texas Air Research Center (TARC Project Number: 077LUB0976)