Download
1 / 1
10 likes | 217 Vues
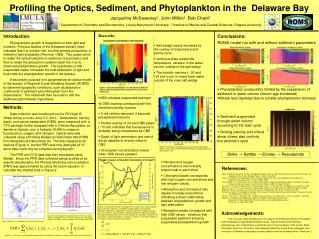
Sediment. Turbidity Maxima. Nitrogen, Oxygen, Chlorophyll & Absorption at 4m Depth . Chlorophyll Conc. (µg/L). Nitrogen & Oxygen Conc. (µM). River Distance (km). Profiling the Optics, Sediment, and Phytoplankton in the Delaware Bay. Jacqueline McSweeney 1 , John Wilkin 2 , Bob Chant 2

E N D
Sediment Turbidity Maxima Nitrogen, Oxygen, Chlorophyll & Absorption at 4m Depth Chlorophyll Conc. (µg/L) Nitrogen & Oxygen Conc. (µM) River Distance (km) Profiling the Optics, Sediment, and Phytoplankton in the Delaware Bay Jacqueline McSweeney1, John Wilkin2, Bob Chant2 1 Department of Chemistry and Biochemistry, Loyola Marymount University, 2 Institute of Marine and Coastal Sciences, Rutgers University Introduction: Phytoplankton growth is dependent on both light and nutrients. Previous studies of the Delaware estuary have indicated that it is nutrient-rich, but that primary productivity is limited by light availability (Pennock 1985). This project aims to relate the optical behavior to sediment concentration and then to relate the absorption variation down the river to observed phytoplankton growth. The hypothesis is that suspended matter increases the total absorption of light and thus limits the phytoplankton growth in the estuary. A secondary purpose is to parameterize an optical model of the estuary in Regional Ocean Modeling System (ROMS) by determining specific conditions, such as absorption coefficients of sediment and chlorophyll, from the observations. The model will then be used to test the sediment-light limitation hypothesis. Results: Conclusions: ROMS model run with and without sediment parameters • Salt wedge clearly illustrated by the overlay of temperature and salinity plots • Vertical profiles reveal little temperature variation in the water • column outside of the salt wedge • The turbidity maxima (~ 90 and 120 km) occur in nearly fresh water outside of the main salt wedge • Phytoplankton productivity limited by the suspension of sediment in water column (bloom age shortened) • Nitrate less depleted due to smaller phytoplankton biomass Chlorophyll, OBS and PAR in the Delaware • OBS indicates suspended sediment • 2 OBS maxima correspond with the identified turbidity maxima • 2 red centers represent 2 separate phytoplankton blooms • Perfect overlay of chl and OBS peaks (~15 km) indicates that fluorescence is probably being misdetected as OBS • Depth of light penetration and rate of decay appears to directly relate to OBS • Chlorophyll concentrations lowest when OBS values greatest Methods: Data collection was conducted via the RV Hugh R. Sharp during a cruise June 3-5, 2010. Temperature, salinity, depth, and optical backscatter (OBS), were measured with a CTD package further equipped with a Chelsea Aquatraka, an Aanderra Optode, and a Satlantic SUNA to measure fluorescence, oxygen, and nitrogen. Optical data was collected using a Profiling Radiance Radiometer 600 (PRR) from Biospherical Instruments Inc. The ship stopped at 22 stations (Figure 1), but the PRR was only deployed at 19 since data could only be collected during daylight. The PRR and CTD data was then processed using Matlab. Since the PRR data collected optical profiles at six specific wavelengths, the Photosynthetically active radiation (PAR) was approximated by using the below equation to calculate the shaded area in Figure 2. • Sediment suspended through water column according to the tidal cycle • Sinking velocity and critical shear stress also controls the sediment cycle Chl Peak Chl Peak Figure 4. Color plot of chlorophyll (µg/L), gray-scale contour plot of OBS (V) and red plots of PAR (W/m2) penetration according depth and river distance. The Sinks → Settles → Erodes → Resuspends • Nitrogen and oxygen concentrations are inversely proportional to each other. • Chlorophyll peaks corresponds with high oxygen concentrations and low nitrogen values. • Absorption and chlorophyll also appear inversely proportional, indicating a direct relationship between phytoplankton growth and light attenuation • Absorption peaks correspond with high OBS values - evidence that suspended sediment indirectly suppresses phytoplankton growth References: Alpine, Andrea E. and James E Cloern. Phytoplankton growth rates in a light-limited environment, San Francisco Bay. US Geological Series. Marine Ecology Progress Series, 5 May1988. Cahill et al. Dynamics of turbid buoyant plumes and the feedbacks on near-shore biogeochemistry and physics. Geophysical Research Letters, vol. 35, L10605. 2008. Cook, Timothy, C. K. Sommerfield, and K.C Wong. Observations of tidal and springtime sediment transport in the upper Delaware Estuary. Estuarine, Coastal and Shelf Science (2007)72, Pages 235-246 Kirk, John T. O. Light and Photosynthesis in Aquatic Ecosystems. 2nd ed. New York: Cambridge University Press, 1994 Mann, K.H., and J. R. N Lazier. Dynamics of Marine Ecosystems. 3rd ed. Massachusetts: Blackwell Publishing, 2006 Middleton, Gerald V. Data Analysis in the Earth Sciences Using Matlab, New Jersey: Prentice Hall, 2000. Pennock, Jonathan R. Chlorophyll Distributions in the Delaware Estuary: Regulation by Light-limitation. Estuarine, Coastal, and Shelf Science (1985) 21, 711-725. Paulson, C. A., and J. J. Simpson, 1997. Irradiance measurements in the upper ocean, J. Phys. Oceanogr., 7, 952-956 Wang et al. Regulation of phytoplankton carbon to chlorophyll ratio by light, nutrients and temperature in the equatorial Pacific Ocean: a basin-scale model. Biogeosciences Discussions, 5, 3869 -3903, 2008. Figure 5. Average concentrations of nitrogen(red), oxygen (blue), and chlorophyll (green) from the surface to a 4 m depth are plotted against river distance. Absorption coefficients (multiplied by a correction factor) were plotted along the same axis (black) to show the relative relationship between chlorophyll and light attenuation. Below equations were used to calculate the absorption coefficients (b) . Light decay is exponential when b is constant. In reality, b is a function of depth (z), so irradiance (I) won’t decrease exponentially. Acknowledgements: This work was made possible due to the support of the National Science Foundation and the Regional Ocean Modeling System group. Special thanks to the following people/groups who contributed in a significant way to the progression of the project: Maria Aristizabal, Dove Guo, Eli Hunter, Chip Haldeman, Matt Taynor and those colleagues from University of Delaware collaborating in data collection from the Delaware River. Thank you! :) Figure 2. Example graph of the approximation of PAR from a typical spectrum. The black curve is the actual irradiance over a wavelength range of ≈ 400-700 nm and the shaded area is the approximated PAR. Figure 1. Map of the 22 sampling stations in the Delaware River. Equation 1. PAR values were calculated by approximating the integration of irradiance (a function of wavelength) from 400 to 700 nm.