Download
1 / 25
260 likes | 406 Vues
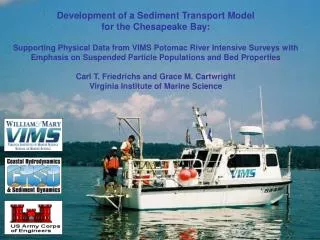
Coupling Suspended Sediment Dynamics and Light Penetration in the Upper Chesapeake Bay. Charles L. Gallegos Smithsonian Environmental Research Center. Photos by Grace Cartwright. Outline. Review Model Refinement Field Work Potomac findings Baywide extension Summary.

E N D
Coupling Suspended Sediment Dynamics and Light Penetration in the Upper Chesapeake Bay Charles L. Gallegos Smithsonian Environmental Research Center Photos by Grace Cartwright
Outline • Review • Model Refinement • Field Work • Potomac findings • Baywide extension • Summary
Elements of Radiative Transfer Modeling in Natural Waters • Radiative Transfer Equations perform an energy balance on an infinitesimal solid angle, accounting for gains and losses • First-order effects are governed by the magnitude of inherent optical properties (IOPs): absorption coefficient, scattering coefficient, and scattering phase function (principally, backscattering:total scattering ratio) • Primary water quality determinants of the IOPs are colored dissolved organic matter (CDOM), phytoplankton pigments, and other particulates (detritus, suspended minerals).
In Situ (total-water) • WETLabs Spectral ac-9 Inherent Optical Properties Absorption Coefficient Laboratory • Water: From published tables (Pope and Fry 1997) • CDOM: Spectrophotometric with long path cell • Particulate: Filter pad method
Inherent Optical Properties Scattering Coefficient Particulate Scattering Beam Attenuation Total Absorption Also measured using WETLabs ac-9 in situ or in laboratory.
Inherent Optical Properties Scattering Phase Function, b(q)/b • Probability distribution of scattered photons • Strongly peaked in the forward direction • Well specified by the ratio of backscattering:total scattering, bb/b • Measured in situ by HOBILABS Hydroscat-6 or WETLabs ECO-VSF-3 Backscattering, bb Forward scattering, bf
Kd Relationship Revisited:Parameterize effects of variations in… • Solar incidence angle, µ0 • Relative proportion of scattering and absorption, principally b:a ratio • Backscattering ratio, bb:b • Optical depth, c·z • Direct and diffuse incident light *--New complexity
New Bio-optical Model is Based On*: Ratio backscattering:total scattering Cosine in-water solar zenith angle Depends on: optical depth, backscattering ratio, solar zenith angle, and scattering:absorption ratio. *—Albert, A., and C. D. Mobley. 2003. An analytical model for subsurface irradiance and remote sensing reflectance in deep and shallow case-2 waters. Optics Express 11: 2873-2890.
Implementation • Algorithm has 33 equations due to multiple dependencies of kz on other parameters (i.e. bb/b, b/a, etc.) • Some of the governing parameters, e.g. backscatter ratio, are poorly represented in data • Solution at each cell and time step would place excessive drag on complete model
Look-up Table Approach • Used bio-optical model to generate Kd values for a range of inherent optical properties in nested loops of: • I: Cosine solar angle (8 bins, 0.71-0.91) • J: CDOM (20 bins, 0.1-8 m-1) • K: Chlorophyll absorption (35 bins, 0.02-18.4 m-1) • L: Particulate scattering (35 bins, 0.6-570 m-1) • M: Particulate absorption:scattering ratio (10 bins, 0.06-0.24) • Resulting array consists of 1,960,000 values of Kd(PAR)
Lookup Table Approach cont’d. • Initialize: • Read in Kd(PAR) array • Read in season- and segment-specific inherent optical properties • From date, segment, and water quality (CDOM, chlorophyll & TSS), search bins to find I, J, K, L, & M • Look up Kd(PAR) in array
Lookup Table Approach cont’d.Must Determine… • Absorption by CDOM • Absorption by chlorophyll • Product of specific-absorption coefficient and chlorophyll concentration • Scattering by particulates • Product of specific-scattering coefficient and TSS concentration • Absorption by non-algal particulates • Product of scattering and absorption:scattering ratio Need: CDOM absorption, and specific-absorption and –scattering coefficients on segment and season basis
CDOM Concentrations: Potomac • Seasonal variability>>Spatial • Current sampling program expected to be adequate characterization
Chlorophyll-specific Absorption: Potomac Forced zero-intercept Regressions *Point-estimate af(675)/[Chla] Ensemble mean: 0.030 m2 mg-1 af*(675) = 0.028 m2 mg-1 Mar-Jun 0.018 m2 mg-1 Aug-Sep *—Necessary when sample size is small
Particulate Scattering: Potomac • Forced zero-intercept: = 0.57 m2 g-1 • Ensemble average of point-estimates = 0.94 m2 g-1 • Varies systematically along river axis
NAP Absorption:Scattering Ratio: Potomac Define “Particle Color Index”, PCI, • From forced zero-intercept regression, PCI=0.088 • Ensemble average, PCI=0.12 • Variability principally temporal
Light Attenuation Model Evaluation Based on Measured Coefficients—Potomac River • 2004 data • Slope (model vs. obs.) = 0.98, r2=0.75 • Used measured, station-averaged coefficients
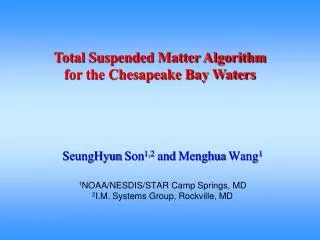
Light Attenuation Model Bay-wide Extension Based on Look-up Table Approach Chesapeake Bay Program Data 5,873 Observations 1995-1999
Implications for Prediction of Kd(PAR) • Difficult to measure in RET/TF sections of river due to high concentrations of TSS saturating instrument • Available data indicates systematic longitudinal gradient • Direct measurements unavailable elsewhere, except CB4MH (average=-.0125) • Ca. 30% change in simulated Kd(PAR) due to changes in bb/b alone • For assumed condition, change crosses SAV Tier II habitat requirement Constant Water Quality Assumed: CDOM=0.5 m-1; Chla=6 mg m-3; TSS=12.7 g m-3; based on 6/15/05, PR04 Backscatter Fraction: Potomac
To Do • Re-generate Kd for Lookup Table varying backscatter ratio, bb/b • Modify Lookup Table routine to take advantage of further bb/b data as it becomes available Symbols for diagrams courtesy of the Integration and Application Network (ian.umces.edu/symbols), University of Maryland Center for Environmental Science.