Download
1 / 17
180 likes | 352 Vues
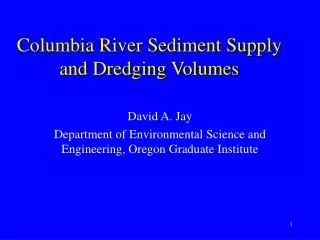
Suspended Sediment Dynamics of the Columbia River Estuary. David A. Jay Department of Environmental Science and Engineering, Oregon Graduate Institute. Salinity and/or SPM Data Available:. Meager historic data: 1933, 1957, 1960s, 1970s, mostly USGS and Corps of Engineers

E N D
Suspended Sediment Dynamics of the Columbia River Estuary David A. Jay Department of Environmental Science and Engineering, Oregon Graduate Institute
Salinity and/or SPM Data Available: • Meager historic data: 1933, 1957, 1960s, 1970s, mostly USGS and Corps of Engineers • CREDDP/NOS data sets 1980-81 -- most extensive salinity, velocity data set • NSF Land-Margin Ecosystem Research Program, 1990-99 best joint salinity, velocity SPM data set for process studies • CORIE (ONR, NMFS) 1997-date monitoring of velocity, acoustic SPM, some salinity
Fine Sediment Supply -- • 1946-99 supply is ~8 x10⁶ mt tons yr-1 (CR+WR, excludes sand) • SPM supply ~ QRn, n = 2.5, so SPM supply is higher in high-flow years • Winter freshets supply much more fine sediment, with SPM supply ~ QRn, n = 3.5 -4.5, but not more sand • Quality of SPM varies seasonally: • organics generally 1-5% • winter SPM has higher mineral and woody content • ETM productivity throughout the year based on SPM supplied during the spring freshet
Overview of Estuarine SPM Processes -- • Two “reservoirs” of fine sediment in the estuary: • Estuarine turbidity maximum (ETM), in sand-bedded channels where fines are transient on bed • Peripheral areas (fines permanent part of bed) • Much storage in bays is also transient: • Channels are re-supplied on spring tides after freshet • ETM material shows signs of having been in an anoxic bed • 70% of SPM is exported, 30% retained in peripheral areas (USGS, based on Hanford nucleotides) • Microbial processing of organic detritus from river forms basis of ETM food web • Salmonids may be more dependent on macro-detritus
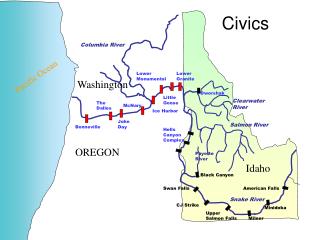
ETM locations and CORIE Stations -- • Tansy, Am169 and Am012 are in the ETM • Am169 and Am012 duplicate 1980 stations
Conceptual View of ETM -- • ETM occurs near upstream limits of salinity intrusion due to particle trapping by tides and mean flow • Two ETM -- in North and South Channels
Conceptual View of ETM -- • ETM food web based on epibenthic grazing on particles and bacteria
Retention of SPM in the Estuary -- • Depends on: • salinity intrusion length -- ETM occurs “near” head of salinity intrusion • strength of estuarine circulation -- two layer flow and tides tends to trap SPM • strength of tides -- neap tides trap SPM on bed, spring tides put SPM into water column and export it • topography -- governs position of salinity intrusion and strength of two-layer flow
Factors Governing Salinity Intrusion: • For a channel of simple form -- • Two-layer estuarine flow and salinity intrusion vary ~H3/Km, (H is controlling depth, Km is vertical mixing coeff.) • Salinity stratification varies as ~H5/Km2 • bars, holes and constrictions modify this somewhat • Spring tides cause strong mixing, increasing Km • During low-flow neaps, Km decreases greatly, increasing salinity intrusion/stratification (neap-spring transition). • Increasing H may cause neap-spring transitions to occur at higher flows • Salinity intrusion varies with river flow as QRm, 1/7<m<1
Neap-Spring Changes in Salinity Intrusion -- • Maximum salinity intrusion occurs on neap for most flows • for low-flow years seasonal and neap-spring changes are similar
Changes in Salinity Intrusion with QR -- • High and low-flow neap-tide salinity intrusion • 4x change in flow causes ~2x change in intrusion length
SPM Residence Time TR, May to December 1997 --(SPM determined from CORIE ADCP backscatter; Fain et al., submitted 2000. TR is the the SPM inventory divided by the supply rate ) • SPM expelled on every spring tide during freshet (<d 170) • TR 30-60 d in the South Channel, up to 120 d in the North Channel • Implies that ETM re-supplied from peripheral areas
SPM Reservoirs (Summer) -- • SPM in transport in river -- 60-120 x 103 mt tons, mostly in water column • SPM in ETM area -- 120-250 103 x mt tons, on bed or in water column • Mobile material in peripheral bays -- ?? mt, temporarily on bed, but can be resuspended and supplied to ETM • Reservoirs are large relative to amount of fines to be dredged
1997 SPM Transport Patterns -- • During Freshet, SPM is exported at all stations on spring tides • After freshet, SPM is exported from South Channel, but moves landward in the north channel (red arrows are near-bed transport, green near-surface; from Fain et al., submitted 2000)
Estuarine Trapping Efficiency E -- • Trapping Efficiency E = SPMmax/SPMriver • CR is moderately effective at particle trapping • Maximum E occurs at intermediate QR in both channels • E greater in North Channel, reflects greater TR (from Jay et al., submitted 2001) QR
Summary of Possible Project Impacts on SPM and Toxics -- • Changing ETM position through changes in salinity intrusion and salinity stratification • Changing residence time TR for SPM and toxics • Changing timing of toxic inputs to ETM • Changes to ETM food web, related to changes in ETM position and TR
Recommended Monitoring/Studies -- • Monitor salinity intrusion and stratification, and SPM concentrations at strategic locations • Analyze historic salinity and SPM to data to detect changes related to changing channel depth • Understand toxics in relation to land-use, sediment supply and sediment transport processes