Download
1 / 36
360 likes | 568 Vues
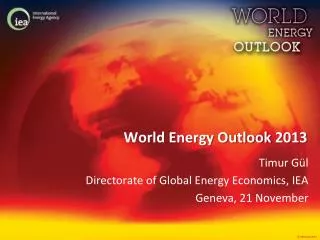
World Energy Outlook and the Prospects for Sustainable Sources. International Symposium on Solar Energy from Space September 8-10, 2009 Ontario Science Centre, Toronto, Canada Dr. R. Bryan Erb. Messages. Energy demand will continue to grow strongly

E N D
World Energy Outlook and theProspects for Sustainable Sources International Symposium on Solar Energy from Space September 8-10, 2009 Ontario Science Centre, Toronto, Canada Dr. R. Bryan Erb
Messages • Energy demand will continue to grow strongly • Alternatives to “Business as Usual” (BAU) can limit emissions to acceptable levels • Renewable sources will dominate • Investments need to be large • Strong environmental policies will be required • Space Solar Power will be competitive R. Bryan Erb
Outline • Concerns • Drivers for energy needs • Current world energy situation • Energy trends • Approaches to stabilizing GHG emissions • Decarbonizing fossil fuels • Expanding the use of renewables • Renewables that will be significant • Investments • Space Solar Power will be competitive R. Bryan Erb
Concerns • The World Energy Outlook – Troubling! Why? • Continuing BAU will aggravate climate impacts • Alternatives to present sources will be challenging to implement at the needed scale • Consumption will grow as population increases and must grow to help those in energy poverty • Food and fiber production must be increased without damaging lands and biota • Global energy infrastructure is so vast and complex that change can come only slowly R. Bryan Erb
Drivers For Energy Needs • Population • Currently 6.5 Billion • Expect 10 B by 2050 and 11.6 B by 2100 • Economic activity • Gross world product currently $38 Trillion • Expect $75 B by 2050 and $200+ B by 2100 • Efficiency of energy utilization • Desire to reduce inequities in global energy availability R. Bryan Erb
The Current World Energy Situation • Will be described by: • Total quantity of energy produced and its distribution among major economic regions • Level of economic activity supported by this quantity of energy • Sources of energy • Resource availability • Environmental implications R. Bryan Erb
Quantity of Energy and Economic Activity • World Total Primary Energy Supply (TPES) in 2006: 15,600 GWth • Gross World Product: $38 Trillion US • Population: 6.5 Billion • TPES per person: 2.4 KWth • Carbon emissions: 7,600 MtC R. Bryan Erb
TPES per Person by Region KWth R. Bryan Erb
Primary Energy Sources - 2004 R. Bryan Erb
Distribution of the 0.5% of “Others” R. Bryan Erb
Resource Availability & Environmental Implications • Near Term Resources: “There are sufficient reserves of most types of energy resources to last at least several decades at current rates of use” … IPCC • Environment: A major and growing issue R. Bryan Erb
Energy Trends • Projections are based on the scenarios of the World Energy Council/IIASA and extend to 2100 • Drivers are: • Population – 10.06 Billion in 2050, 11.65 by 2100 • Economic Activity - $75 to 100 B depending on scenario • Technology choices - especially acceptability of coal and nuclear • Three broad scenarios – A, high growth; B, “business as usual”; C, ecologically driven R. Bryan Erb
Energy History and Projections GWth R. Bryan Erb
Representative Scenarios • Three of the WEC/IIASA scenarios chosen to illustrate a range of possible energy futures: B - BAU A2 - highest emissions scenario C1 - least use of nuclear R. Bryan Erb
Environmental Outlook • Only the “Ecologically-Driven” scenarios reduce emissions significantly • Net emissions of energy-related Carbon are reduced to tolerable levels by 2100 • Atmospheric CO2 concentration by 2100 stabilizes in the range of 450 to 550 ppm • This concentration should limit warming to two to three degrees C • Each of these has its own particular makeup of energy sources R. Bryan Erb
Energy Share by Source - B R. Bryan Erb
Energy Share by Source - A2 Year R. Bryan Erb
Energy Share by Source – C1 R. Bryan Erb
Outlook for Resource Availability • WEC projects adequate resource availability over the next 100 years, but foresees that a shift in sources will be driven by: • Environmental impacts • Economic recoverability of the resources R. Bryan Erb
Net Carbon Emissions from Energy R. Bryan Erb
Approaches To StabilizingGHG Emissions • There are two fundamental approaches on the energy front: • Reducing the impact of fossil fuels, i.e., “Decarbonizing” them • Expanding the use of renewables or nuclear Note: there are other ways of influencing climate, including various forms of Geo/Climate engineering R. Bryan Erb
Decarbonizing Fossil Fuels • Approaches include: • Shifting to lower carbon fuels, e.g., gas vs. coal • Improving the efficiency of use of such fuels • Capturing and sequestering the carbon (CCS): • “upstream” in the supply process, or • “downstream” in the utilization process • These measures are necessary but not sufficient – major expansion in the supply from renewable sources is vital R. Bryan Erb
Renewables • Renewable sources include: hydro, biomass, solar, wind, geothermal and various forms of ocean/tidal/wave energy • Each has its own peculiar advantages and drawbacks • Only some can be exploited at a scale and in a time frame that will make a significant contribution R. Bryan Erb
Sources Viewed as Limited • Hydro – only modest scope for expansion • Biomass – important for fuels, but limited by competition for land • Geothermal - locally important, but not a large-scale source unless the “Engineered Geothermal Systems” approach can be developed successfully • Ocean/tidal/wave - resources are immense yet diffuse and expensive to exploit R. Bryan Erb
Nuclear Outlook • Nuclear suffers from concerns over public acceptance, final waste management and proliferation risk • Little capacity is being added in the OECD countries and some is being removed • However, China, Russia and India have ambitious programs • More widespread use may be needed to meet emissions targets R. Bryan Erb
Significant Renewables:Solar and Wind • Total energy available from these sources is immense, but the energy density is low • Product is largely electricity, the most useful form of energy • The C1 scenario projects that these sources, along with biomass for fuels, will be the dominant sources of the future R. Bryan Erb
Electricity from Solar and Wind TWhr Year R. Bryan Erb
The Matter of Intermittency • It is critical to recognize that solar and wind are intermittent sources and can be used immediately by the power grid only to the extent of 20 - 25% of production • Solar and wind can be more fully exploited to meet base load needs if storage can be provided or if the electricity is used to generate hydrogen R. Bryan Erb
Electricity from Solar and Wind:Extent of Immediate Use Total Electricity Electricity from Solar + Wind R. Bryan Erb
Cost Impact of Intermittency • Solar and wind installations with storage (to serve base load needs) will be more expensive than those providing peak power • Capital costs, by mid-century, of such plants is estimated at ≈ $7000 per KWe • Incremental investment to accommodate this intermittency is estimated at ≈ $1T per year beginning around 2040 (just over 1% of GWP) R. Bryan Erb
Energy Investments • Recent capital expenditures ≈ 1% of GWP • Implementing energy scenarios that reduce emissions significantly will be more costly • Stern Report documents cost estimates at 1% of GWP by 2050 to stabilize atmospheric concentration of CO2 at 500-550ppm • WEC notes costs unlikely to exceed 2% of GWP R. Bryan Erb
Outlook for Space Solar Power • Capital costs for Space Solar Power installations are estimated to be on the order of $4000 per KWe • If terrestrial installations for solar and wind providing base load power run $7,000 per KWe and a Trillion dollars a year is needed to build the needed capacity, then Space Solar Power should be very competitive R. Bryan Erb
An Assessment • Implementing an energy future such as C1 will be extremely challenging, requiring: • Enormous investments • Strong environmental policies • Continuing international cooperation for decades • Consequences of failing to follow such a path: • Serious climate impacts or • Expansion of nuclear supply and/or • Resort to more use of fossil fuels R. Bryan Erb
What Could Change This Picture? • Cheaper ways to store electricity • Power grids of international scale • Economic means of exploiting geothermal or ocean energy • Success in exploiting nuclear fusion R. Bryan Erb
Recommendations • Promote a better general understanding of the world energy situation • Support all plausible sources of sustainable and clean energy, especially Space Solar Power • Support policy actions that reduce emissions, importantly, putting a price on carbon • Support policy actions that improve efficiency • Start now R. Bryan Erb
Take Away • Energy demand will continue to grow strongly • Alternatives to “Business as Usual” can limit emissions to acceptable levels • Renewable sources will dominate • Investments need to be large • Strong environmental policies will be required • Space Solar Power will be competitive R. Bryan Erb