Gerrymandering and Legislative Efficiency
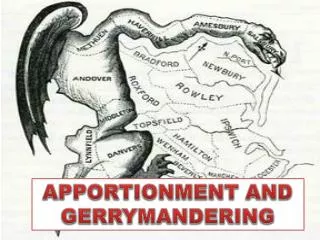
Gerrymandering and Legislative Efficiency. John Mackenzie FREC/CANR University of Delaware. Gerrymandering involves the redrawing of election district boundaries to maximize the number of legislative seats that can be won by the political party in charge of redrawing the district boundaries.

Gerrymandering and Legislative Efficiency
E N D
Presentation Transcript
Gerrymandering and Legislative Efficiency John Mackenzie FREC/CANR University of Delaware
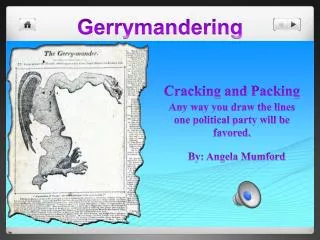
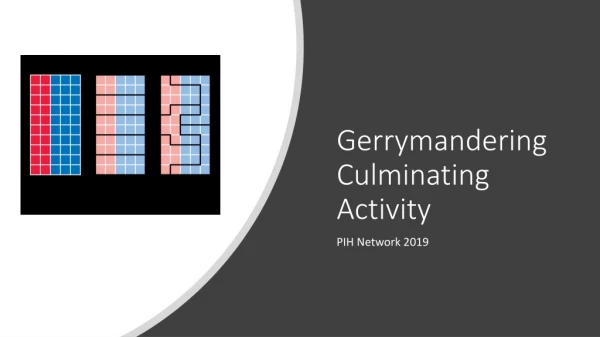
Gerrymandering involves the redrawing of election district boundaries to maximize the number of legislative seats that can be won by the political party in charge of redrawing the district boundaries. Gerrymandering creates “safe” seats for the party’s incumbent legislators. Opposition legislators can be “kidnapped” into hostile districts and defeated.
Do Congressmen in gerrymandered “safe” districts accumulate more seniority, committee chairmanships, clout, etc. that benefit their constituents… …or do they get lazy?What is the net benefit (or cost) of gerrymandering?
The Constitution only guarantees that your actual vote is secret.Your age, sex, household composition, address, phone number, party registration and voting history are all public record, and made available to political parties and candidates. Voter databases are now routinely geo-coded and can support high-precision gerrymandering via GIS.
Data SourcesGIS shapefile of district boundaries for the 109th Congress obtained from the US Census Bureau website www.census.gov/geo/www/cob/bdy_files.htmlConsolidated Federal Funds Report
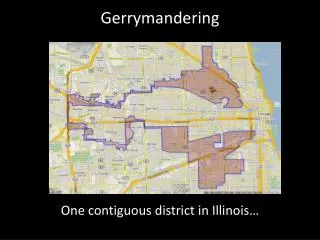
Using geometric compactness as a gerrymandering index:G = area / perimeter squaredG ranges from zero (for a true fractal) to 1/(4π), or ~0.079577 (for a circle). This can be rescaled as desired.
Some state polygons are more compact than others, and a better gerrymandering index would exclude the complexities of state boundaries.A simple refinement of the index would be to normalize each district’s compactness Gd by the state’s compactness Gs
A better approach is to distinguish natural (black) from artificial (red) boundary complexity for each individual district polygon:
Let P = g + n denote total district perimeter as the sum of artificially-drawn interior political boundary length g plus natural exterior boundary length n. The artificially-drawn proportion is g/P, so the polygon complexity attributable to political manipulation is G* = (g/P)(P2/A) = gP/A.
GIS Procedures: • Dissolve Congressional districts by state ID to obtain a shapefile of exactly congruent state boundaries. • use Polygon-to-Line utility to crack the 435 district polygons into 2,232 component boundary segments. These line features include attribute table fields LEFT_FID and RIGHT_FID that identify the polygon feature ID’s on the “left” and “right” sides of each line.
use Select-by-Location “are within (Clementini)” criterion to select the interior district boundaries, identifying 1,318 district boundary line features as not coincident with any state boundary. • Create a LENGTH field in this line shapefile’s attribute table • use Calculate Geometry determine the lengths of these interior boundary segments. The unselected segments on state boundaries were assigned LENGTH values of zero.
Create Summarize tables to sum the LENGTH values for each LEFT_FID and RIGHT_FID. • Join these two Summarize tables to the original district polygon shapefile • Create a new INTLENGTH field in the polygon attribute table • Sum LENGTHs from the two Summarize tables into that field. The revised index: • G* = INTLENGTH*PERIMETER/AREA.
Caveats:This index still omits other natural boundary elements (rivers, etc.)Measurements of natural boundary lengths are scale-dependent (Mandelbrot)Thus any geometric index of gerrymandering must have some degree of arbitrariness.
Maryland 2nd G* = 410 (red shoreline) G* = 318 (black shoreline) G* = 210 (blue convex quasi-hull)
States with Highest Average Gerrymandering Scores
Conclusions:This analysis does not indicate any correlation between the geometric complexity of US Representative district boundaries and the efficiency of Representatives in recapturing federal dollars for their districts.The results do not support the “seniority” hypothesis or the contrary “laziness” hypothesis. Gerrymandering is not shown to cause net harm to district constituents.
![[Legislative]](https://cdn0.slideserve.com/1346884/slide1-dt.jpg)