Download
1 / 37
410 likes | 1.31k Vues
Stand-Alone Solar Inverter with MPPT. Group 1 Andrew O’Connell & Jerry Klosek ECE 445 Senior Design April 25, 2008. To design a low cost solar inverter for areas without grid access or for backup power Affordable High efficiency Battery charger stage for night time use

E N D
Stand-Alone Solar Inverter with MPPT Group 1 Andrew O’Connell & Jerry Klosek ECE 445 Senior Design April 25, 2008
To design a low cost solar inverter for areas without grid access or for backup power Affordable High efficiency Battery charger stage for night time use Maximum power point tracking for best use of photovoltaic panel Objectives
Original Design Topology Power Stages and Test Results Control Performance Summary Cost Analysis Analysis of Challenges Recommendations Overview
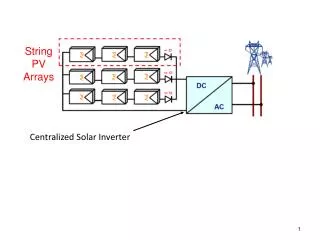
Input: 24-48Vdc, 0-500W Nominal 36V solar panels in parallel Output: 30-75Vdc, 0-500W Maximum power point tracking… Input Stage: Boost Converter
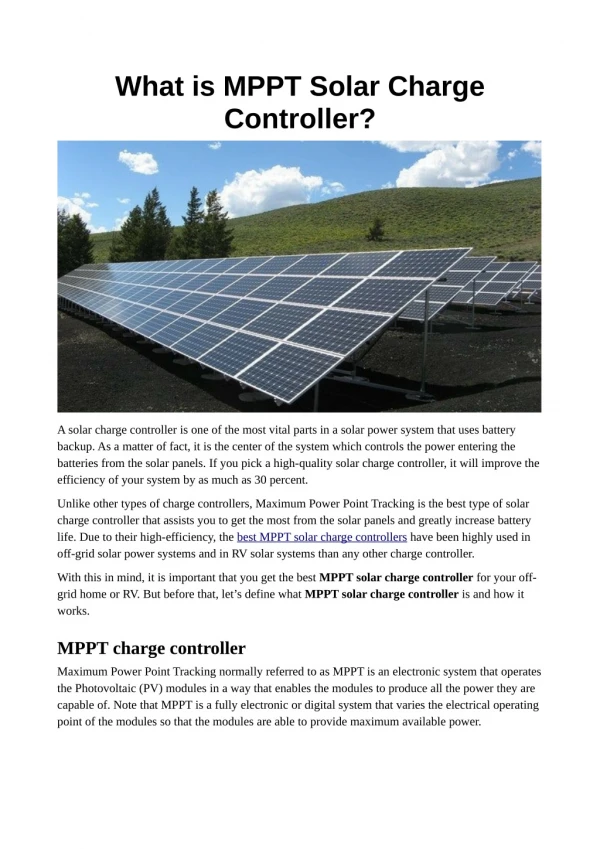
Boost: Maximum Power Point Tracking Getting the most out of the solar panels… • Match the perceived converter impedance to the solar panels for maximum power transfer • Several methods with varying degrees of difficulty… Source: http://en.wikipedia.org/wiki/Image:Solar-Cell-IV-curve-with-MPP.png
Boost Control: MPPT Continued • A Simple Method: Perturb and Observe (P&O) • “Climbing” the V-I Characteristic • Vary duty ratio based on past and present power input • Requires current and voltage sensing Source: http://www.iet.aau.dk/~des/papers/PID253435-1_EPE-PEMC2006.pdf
An even simpler method: Constant Voltage (CV) The point of maximum power transfer occurs at approximately 76% of the open circuit panel voltage The ratio Vmpp/Voc is relatively constant throughout the operating range Only voltage sensing is needed on the input Boost Control: MPPT Continued
Boost Performance Continued Input: 48V Output: 60V Power: 275W Ch1: Vout, Ch2: Vgs, Ch3: Vds, Ch4: Inductor Current
Input: 30-75Vdc from boost Output: 26V for battery charging capability Buck Converter
Buck Performance Continued Input: 50V Output: 26V Power: 125W Note Vds Spikes—FETs only rated for 100V! Ch1: Vout, Ch2: Vgs, Ch3: Vds, Ch4: Inductor Current
Input: 24-26Vdc from buck/battery Output: 31.25kHz, ±13Vac square wave to transformer Half-Bridge Inverter
Half-Bridge Performance Continued Input: 26V Output: ±13V Power: 67W Ch1: Vout, Ch2: Vgs, Ch3: High-side Vds, Ch4: Inductor Current
Desired turns ratio of 14:1 (~180V:13V) Approximately 40A current at 500W Primary side requirement of 10 mm2 of copper 4-5 parallel strands of 14AWG wire Secondary side requirement of 3 mm2 of copper 2 parallel strands of 16AWG wire Multiple turns needed on primary for sufficient magnetic coupling 10 turns on primary corresponds to 140 turns on output! Transformer
Input: ~170Vdc from transformer/classical rectifier Output: 60Hz, 120Vrms sinusoid H-Bridge Inverter
H-Bridge Performance Ch1: Reference Sine Wave, Ch2: Low-side Vds, Ch3: Output Waveform, Ch4: Inverted Output Current Ch1: Vgs Left , Ch2: Vgs Right, Ch4: Output Waveform
Limitations Up to 120Vdc (85VRMS) operation Low load functionality only Inability to adequately filter signal H-Bridge Performance Continued
PIC18F2520 A/D converter Internal 8 MHz oscillator Internal voltage reference 2 Control, Capture, PWM modules for easy duty cycle adjustment Control Implementation: PIC18F2520
Boost Control - Inputs: 0-5V scaled boost input voltage feedback - Outputs: Single 31.25kHz duty control signal (10-80% limited) - Operation: Proportional control on boost input for CV MPPT Buck Control - Inputs: 0-5V scaled buck output voltage feedback - Outputs: Single 31.25kHz duty control signal (10-80% limited) - Operation: Proportional control on buck output for battery regulation Control Implementation: Boost and Buck
Control Implementation: Half-Bridge and H-Bridge • Half-Bridge Control • - Inputs: None (open loop) • - Outputs: Single 31.25kHz, 50% duty cycle control signal • - Operation: Fixed duty cycles open loop control • H-Bridge Control • - Inputs: None (open loop) • - Outputs: Dual 20kHz PWM duty cycle control signals (80% limited) • - Operation: Varied duty cycles based on PWM sinusoid look-up table
Boost stage performed as desired, with an average efficiency of about 92% up to 300W. Buck stage experienced inductive voltage spikes that limited operation to about 150W (even with turn-off snubbers) with an average efficiency of about 90%. Half-Bridge performed as desired until the power was increased above approximately 100W. H-Bridge produced desired waveforms, but was unable to function under high voltages or heavy loads. Open Loop Performance Summary
Losses • Static Losses • Minimize on-state resistance and diode forward voltage • Dynamic Losses • Factor ‘a’ ranges from 1.5 to 2 with no correction • Lower switching frequency • Select low switching time
Total Cost (including transformer estimation): ~$225 Excludes packaging and economies of scale Compare to ~$450 for a typical 500W inverter Modified sine wave The Bottom Line
Inductive Voltage Spikes Even with wire path lengths reduced through use of PCBs, damage to transistors and diodes was consistently a problem Parts were undersized Converter FETs were not given enough voltage head room. Buck was unable to be demonstrated due to slight errors in testing that resulted in FET failure. Turn-off snubbers helped but did not solve the problem Challenges
Testing issues with the half-bridge The half-bridge proved difficult to test because of the nature of its output waveform and the low resistance values needed to reach higher power levels Grounding issues between the input and output prevented the electronic load from being used simultaneously with a high-power source Challenges Continued
PCB Troubleshooting Breadboard tests gave expected results PCB debugging required time and effort High current problems Lack of vias Challenges Continued
Additional PCB revision Increased safety factor on part ratings for reliability Need specialized testing equipment Additional feedback filtering and interference reduction Output filtering I/O protection Recommendations
Special thanks to: Grant Pitel Professor Krein Professor Swenson Acknowledgements