Download
1 / 36
360 likes | 552 Vues
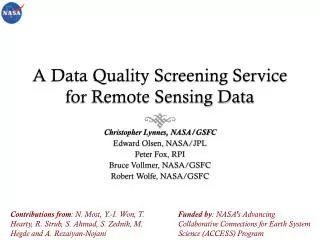
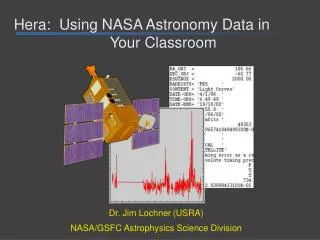
Hera: Using NASA Astronomy Data in Your Classroom. Dr. Jim Lochner (USRA) NASA/GSFC Astrophysics Science Division. Welcome to Student Hera!. Student Hera brings real astronomy into the classroom!

E N D
Hera: Using NASA Astronomy Data in Your Classroom Dr. Jim Lochner (USRA) NASA/GSFC Astrophysics Science Division
Welcome to Student Hera! • Student Hera brings real astronomy into the classroom! • Students use the same software and methods as scientists to study objects in space such as black holes, pulsars, and binary stars. • One small download brings the universe to your fingertips.
What are Hera and Student Hera? • Hera provides an interface to satellite data and analysis tools which are used by scientists. • Neither tools or data need to be downloaded to user’s local computer. • Hera is used by scientists around the world. • Student Hera is a scaled-down interface which provides selected data sets and tools for teachers and students. • Web pages provide walk-through of the tools for students.
Studying pulsars with Student Hera • Looking at objects with an X-ray telescope can teach us about their structure, features, and behavior. • Pulsars are neutron stars (very small, dense stars) that “pulse” with radiation through the rotation of intense magnetic fields. • Observing these pulses can teach us about the rotation, period, and other features of the pulsar!
GX301-2 • GX301-2 is an X-ray binary system -- a pulsar in orbit with a supergiant star. Mass is transferred from the supergiant to the pulsar. • The more mass dumped onto the pulsar, the more X-rays it will emit. • From the data, we can calculate the orbital period and determine the type of orbit.
Exploring Student Hera • It’s easy to get started with Student Hera in the classroom. The website will lead you through installation and getting started. • Student Hera requires one 10MB download from the website. The Windows program has an installation wizard to guide you through set-up. Just click on the Student Hera icon on your desktop, and you’re ready to go! Let’s find the period of GX301-2 using Student Hera!
Exploring Student Hera Student Hera offers a variety of tools and data to explore. Skip to Folding the Data
File Utilities • There are three tools available for viewing the data: • File Dump - Display FITS file in text format. • File List - List specific data in a formatted text table. • Column List - List the type of data in the columns of the FITS file (the variables and their units). • These tools give information about the contents of the data file. • Data Statistics calculates the max, min, mean, and standard deviation of any column.
Light Curves and Periods • A light curve is a graph which shows the brightness of an object over a period of time. • In the study of objects which change their brightness over time, the light curve can help us determine the rotational period of an object, or the orbital period of two objects in a binary system!
File Utilities: File Plot • The File Plot tool will create a light curve from the data you select. • Choose the variables for the axes (in this case, RATE and TIME), and the rows from the data file that you want to plot. This allows you to limit the amount of data plotted.
File Plot: Light Curve This light curve is for 50 rows of data. You can see that such a small sample of data doesn’t show much!
File Plot: Light Curve • Comparing plots of 50, 1000, and 3000 rows, you can see a definite periodic pattern of brightness appearing. • Plotting a the right time span can show the behavior of the system.Plotting too little doesn’t show the periodic motion, but plotting too much will make the peaks close together and hard to see. 50 rows 1000 rows 3000 rows
Estimating the Period • By identifying the peaks in the light curve, you should be able to estimate the orbital period for the system. • From this plot of 3000 rows, it looks like the peaks are around 40 days apart. • The error in this estimate is quite large -- plus or minus 10 days (or more)!
Finding a better period • Now you’ve looked at the periodic motion of GX301-2… but our period is a very rough estimate. We need a more accurate number! • The File Utilities are tools to help you view the data and make an initial assessment. • For a more thorough analysis of the data, we can use another suite of tools: Timing Analysis Tools.
Exploring Student Hera Timing Analysis Tools: • This robust set of utilities offers more precise manipulation and analysis of the data. • The timing analysis tools (XRONOS Tools) provide specialized plots and statistics.
Plot Light Curve • The Plot Light Curve tool in the Timing Analysis utilities is different than the basic File Plot tool. • This tool does not just plot raw data points. It averages the data points into time “bins” (which you specify) in order reduce the noise. • Binning helps to emphasize the peaks in the light curve.
Binning and plotting data • You can experiment with the Plot Light Curve tool using different parameters. Changing the size of the data bins, span of the data, and averaging of the intervals chosen, you can work your way toward the best parameters for a clear picture! • Again, plotting too little or too much can affect the clarity of your plots -- that perfect amount will make the periodic motion stand out.
Folding the data • Binning reduces some of the noise in the plot, but the data is still very messy. A precise period can still be difficult to see. • We can determine the period with a process called folding. • Since the period repeats indefinitely, imagine if we could add all of the periods on top of each other. The peaks would build up, one on top of the next, so the signal would get stronger and the noise would cancel out. • We will use folding to amplify the peaks so we can clearly see the periodic behavior of GX301-2.
What is folding? • Folding is a way to add together, or fold, the periods of a light curve in order to determine an accurate period. • Let’s imagine some simple data…
What is folding? Let’s guess a reasonable period.
What is folding? Let’s do a little binning. The y-axis value for Time Bin 1 would be the mean of the y-axis values for the 1st data point in the red curve and the 1st data point in the blue curve. And so on…
What is folding? Plot the data from that chart. • If your plotted data makes a curve that resembles the original data, you’ve guessed a good period! • If your plotted data makes a straight line or doesn’t look like the original lightcurve… the period you’ve guessed is wrong. You’ll need to start over with a new period. Skip to “What Type of Orbit?”
Search With Fold • The trick to folding data is figuring out the best period for the data. Otherwise, the periods will not match up when folded. • Search With Fold is a tool that can help you discover the best value for the period. • With Search With Fold, you can try different periods (close to your original estimate), and see which value gives the best signal-to-noise ratio when folded. • The software uses a statistical test called chi-squared to assess this signal-to-noise ratio. The period that provides the largest chi-squared is the best match for the data. Search With Fold will create a chi-squared histogram (at right is one for 41.5 days).
Epoch Folding • Search With Fold provided a “best” period of 41.5 days. Now that we have this value, we can create a folded light curve! • The final utility we will use is Epoch Fold. • Our folded light curve will tell us if the period we found is correct -- will our plot look like a periodic light curve? It is time for the moment of truth!
Folded light curve Our folded light curve shows clear periodic motion! We have found a period of 41.5 days.
What type of orbit does the light curve suggest? ? What type of orbit does this light curve suggest ?
Orbital Properties of GX301-2 More Mass - More X-rays 41.5 d period in an eccentric orbit.
GX301-2 Conclusions • You just successfully analyzed X-ray data just like a professional astrophysicist! You employed the same tools and methods used at NASA and other research institutions. • Nearly everything we know about GX301-2 has been found using the same techniques that you use in Student Hera. With Student Hera, you can be an astrophysicist!
What did we learn? • Science topics • Binary star systems, periodic motion, orbits • Math Topics • Pattern recognition, interpreting graphs • Data Analysis Skills • Investigating the nature of a data set • Using software to view and analyze data • Science process skills • Making mathematical models and testing
Classroom uses for Student Hera • Use software and exercises within lessons on related concepts, such as light curves, X-ray astronomy, or binary stars. Plotting tools can create useful visual aids! • Assign students individual or group projects using Student Hera. Projects can be based on the guided activities on the website -- many variations are possible. • Integrate into lessons on mission design and technology. Student Hera offers a look at the real data that comes back from satellites, as well as the specialized analysis and manipulation that scientists perform. • Use with related lessons and activities from online learning resources such as Imagine the Universe! and mission-related sites like the RXTE Learning Center.
College Hera • Hera is also available as a 2-hour lab experience for 1st year college astronomy courses. • http://imagine.gsfc.nasa.gov/docs/teachers/hera_college/ • Developed by Dr. Beth Hufnagel, Anne Arundel Community College, Maryland
The future of Student Hera • The File Utilities and Timing Analysis Tools, plus all related lesson plans and materials, are currently available online. • We appreciate any feedback you may have!Student and teacher evaluation questionnaires are available. • An Imaging module is available. Spectroscopy module under development.
Links and Resources • Student Hera on Imagine the Universe!http://imagine.gsfc.nasa.gov/docs/teachers/lessons/hera/ • Student Hera Teacher’s ManualTeachersManual.pdf in above directory • The RXTE Learning Centerhttp://rxte.gsfc.nasa.gov/docs/xte/learning_center/ • Contact: Lochner@milkyway.gsfc.nasa.gov
Conclusions • Using a series of qualitative and quantitative measurements, we have discovered that the neutron star and supergiant in GX301-2 orbit each another once every 41.5 days. The orbital period we have found using Student Hera matches the period published by British scientists in 1982. The scientists also used their data (from a different instrument) to examine the eccentric orbit of the binary system and the interactions between the two stars.