Download
1 / 50
500 likes | 702 Vues
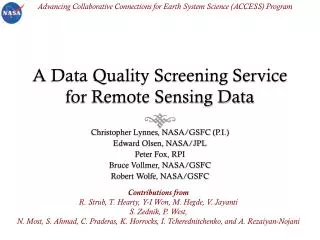
Advancing Collaborative Connections for Earth System Science (ACCESS) Program. A Data Quality Screening Service for Remote Sensing Data. Christopher Lynnes, NASA/GSFC (P.I.) Edward Olsen, NASA/JPL Peter Fox, RPI Bruce Vollmer, NASA/GSFC Robert Wolfe, NASA/GSFC. Contributions from

E N D
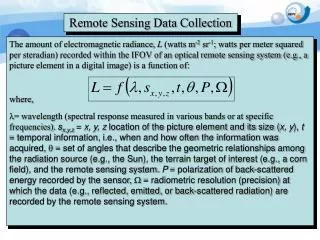
Advancing Collaborative Connections for Earth System Science (ACCESS) Program A Data Quality Screening Service for Remote Sensing Data Christopher Lynnes, NASA/GSFC (P.I.) Edward Olsen, NASA/JPL Peter Fox, RPI Bruce Vollmer, NASA/GSFC Robert Wolfe, NASA/GSFC Contributions from R. Strub, T. Hearty, Y-I Won, M. Hegde, V. Jayanti S. Zednik, P. West, N. Most, S. Ahmad, C. Praderas, K. Horrocks, I. Tcherednitchenko, and A. Rezaiyan-Nojani
Outline Why a Data Quality Screening Service? Making Quality Information Easier to Use via the Data Quality Screening Service (DQSS) DEMO DQSS Architecture DQSS Accomplishments DQSS Going Forward The Complexity of Data Quality
The quality of data can vary considerably Version 5 Level 2 Standard Retrieval Statistics
Quality schemes can be relatively simple… Total Column Precipitable Water Qual_H2O kg/m2 Best Good Do Not Use
…or they can be more complicated Hurricane Ike, viewed by the Atmospheric Infrared Sounder (AIRS) 300 mbar Air Temperatureat 300 mbar PBest : Maximum pressure for which quality value is “Best” in temperature profiles
Quality flags are also sometimes packed together into bytes Snow/ Ice Flag 0=Yes1=No Day / Night Flag 0=Night1=Day Cloud Mask Status Flag 0=Undetermined1=Determined Sunglint Flag 0=Yes1=No Cloud Mask Cloudiness Flag 0=Confident cloudy 1=Probably cloudy 2=Probably clear 3=Confident clear Surface Type Flag 0=Ocean, deep lake/river 1=Coast, shallow lake/river 2=Desert 3=Land Big-endian arrangement for the Cloud_Mask_SDS variable in atmospheric products from Moderate Resolution Imaging Spectroradiometer (MODIS)
Recommendations for quality filtering can be confusing Opposite direction for QC codes MODIS Aerosols Confidence Flags AIRS Quality Indicators Ocean Land 3 Very Good 2 Good 1 Marginal 0 Poor 3 Very Good 2 Good 1 Marginal 0 Poor Data Assim. Best 0 Climatic Studies Good 1 Do Not Use Do Not Use 2 Use these flags in order to stay within expected error bounds Different framing for recommendations Ocean Land ±0.05 ± 0.15 t ±0.03 ± 0.10 t
Current user scenarios... Repeat for each user • Nominal scenario • Search for and download data • Locate documentation on handling quality • Read & understand documentation on quality • Write custom routine to filter out bad pixels • Equally likely scenario (especially in user communitiesnot familiar with satellite data) • Search for and download data • Assume that quality has a negligible effect
The effect of bad qualitydata is often not negligible Hurricane Ike, 9/10/2008 Total Column Precipitable Water Quality Best Good Do Not Use kg/m2
Neglecting quality may introduce bias (a more subtle effect) AIRS Relative Humidity Comparison against Dropsonde with and without Applying PBest Quality Flag FilteringBoxed data points indicate AIRS Relative Humidity data with dry bias > 20% without QC filtering with QC filtering From a study by Sun Wong (JPL) on specific humidity in the Atlantic Main Development Region for Tropical Storms
Percent of Biased-High Data in MODIS Aerosols Over Land Increases as Confidence Flag Decreases Poor *Compliant data are within + 0.05 + 0.2τAeronet Statistics derived from Hyer, E., J. Reid, and J. Zhang, 2010, An over-land aerosol optical depth data set for data assimilation by filtering, correction, and aggregation of MODIS Collection 5 optical depth retrievals, Atmos. Meas. Tech., 3, 4091–4167.
Making Quality Information Easier to Use via the Data Quality Screening Service (DQSS)
DQSS Team • P.I.: Christopher Lynnes • Software Implementation: Goddard Earth Sciences Data and Information Services Center • Implementation: Richard Strub • Local Domain Experts (AIRS): Thomas Hearty and Bruce Vollmer • AIRS Domain Expert: Edward Olsen, AIRS/JPL • MODIS Implementation • Implementation: Neal Most, Ali Rezaiyan, Cid Praderas, Karen Horrocks, Ivan Tcherednitchenko • Domain Experts: Robert Wolfe and Suraiya Ahmad • Semantic Engineering: Tetherless World Constellation @ RPI • Peter Fox, Stephan Zednik, Patrick West
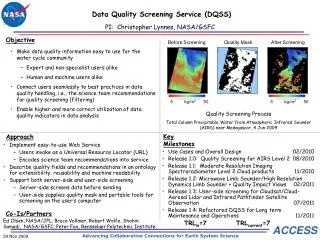
The DQSS filters out bad pixels for the user • Default user scenario • Search for data • Select science team recommendation for quality screening (filtering) • Download screened data • More advanced scenario • Search for data • Select custom quality screening options • Download screened data
DQSS replaces bad-quality pixels with fill values Original data array (Total column precipitable water) Mask based on user criteria (Quality level < 1*) Good quality data pixels retained Output file has the same format and structure as the input file (except for extra mask and original_data fields) *0 = Best
Visualizations help users see the effect of different quality filters
DQSS can encode the science team recommendations on quality screening • AIRS Level 2 Standard Product • Use only Best for data assimilation uses • Use Best+Good for climatic studies • MODIS Aerosols • Use only VeryGood (highest value) over land • Use Marginal+Good+VeryGood over ocean
Or, users can select their own criteria... Initial settings are based on Science Team recommendation. (Note: “Good” retains retrievals that are Good or better). You can choose settings for all parameters at once... ...or variable by variable
DEMO • http://ladsweb.nascom.nasa.gov • Select Terra or Aqua Level 2 Atmosphere • Select “51 - Collection 5.1”! • Add results to Shopping Cart (do not go directly to “Order Now”) • Go to shopping cart and ask to “Post-Process and Order” • http://mirador.gsfc.nasa.gov • (Search for ‘AIRX2RET’)
DQSS Flow data file w/ mask screened data file End User data file Screener quality mask Masker Quality Ontology Ontology Query user selection
DQSS Ontology(The Whole Enchilada) Data Field Binding Module Data Field Semantics Module Quality View Module
DQSS encapsulates ontology and screening parameters data product DQSS Ontology Service LAADSWebGUI screening options selected options screening recipe (XML) screening recipe (XML) MODAPS Database MODAPS Minions screening parameters (XML) Encapsulation enables reuse in other data centers with diverse environments.
DQSS Accomplishments • DQSS is operational at two EOSDIS data centers: TRL = 9 • MODIS L2 Aerosols • MLS L2 Water Vapor • AIRS Level 2 Retrievals • MODIS L2 Water Vapor • Metrics are being collected routinely • DQSS is almost released (All known paperwork filed)
Papers and Presentations Managing Data Quality for Collaborative Science workshop (peer-reviewed paper + talk) Sounder Science meeting talk ESDSWG Poster ESIP Poster A-Train User Workshop (part of GES DISC presentation) AGU: Ambiguity of Data Quality in Remote Sensing Data
Metrics *DQSS is the first multi-DAAC bridge for ACCESS • DQSS is included in web access logs sent to EOSDIS Metrics System (EMS) • Tagged with “Protocol” DQSS • EMS MCT (ESDS Metrics) bridge implemented for both DAACs* • Metrics from EMS: • Users: 208 • Downloads: 73,452 • But still mostly AIRS, some MLS • MODIS L2 Aerosol may be the “breakthrough” product
ESDSWG Participation by DQSS • Active participant (Lynnes) in Technology Infusion Working Group • Subgroups: Semantic Web, Interoperability and Processes and Strategies • Established and led two ESIP clusters as technology infusion activities • Federated Search Discovery • Earth Science Collaboratory • Participated in ESDSWG reorganization tiger team • Founded ESDSWG colloquium series
DQSS Spinoff Benefits • DQSS staff unearthed a subtle error in the MODIS Dark Target Aerosols algorithm • Quality Confidence flags are sometimes set to Very Good, Good or Marginal when they should be marked as “Bad” • Fixed in Version 6 of the algorithm • Also fixed in Aerostat ACCESS project • Semantic Web technology infusion in DQSS enables future infusion of the RPI component of Multi-Sensor Data Synergy Advisor into the Atmospheric Composition Portal • Shared skills, shared language, shared tools • The Earth Science Collaboratory concept was born in a discussion with Kuo about DQSS in the ESDSWG Poster Session in New Orleans.
Going Forward • Maintain software as part of GES DISC core services • Modify as necessary for new releases • New data product versions have simpler quality schemes • Add data products as part of data support • Sustainability Test: How long to add a product? • Answer: a couple days for MLS Ozone • Continue outreach • Demonstrated to scientists in NASA ARSET • Release Software and Technology
DQSS Recap • Screening satellite data can be difficult and time consuming for users • The Data Quality Screening System provides an easy-to-use service • The result should be: • More attention to quality on users’ part • More accurate handling of quality information… • …With less user effort
The Complexity of Data QualityPart 1 QC guess quality assessment Algorithm version N Data Product version N Science Team improved QC estimation QC guess quality assessment Algorithm version N+1 Data Product version N+1 Science Team • Quality Control ≠ Quality Assessment • QC represents algorithm’s “happiness” with an individual retrieval or profile at “pixel” level • QA is science team’s statistical assessment of quality at the product level, based on cal / val campaigns
QC vs. QA – User View Give me just the good- quality data values Quality Control Data Provider Tell me how good the dataset is Quality Assessment
Quality (Priority) is in the Eye of the Beholder Climate researchers: long-term consistency, temporal coverage, spatial coverage Algorithm developers: accuracy of retrievals, information content Data assimilators: spatial consistency Applications: latency, spatial resolution Education/Outreach: usability, simplicity
Recommendation 1: Harmonize Quality Terms Land Surface Temperature anomaly from Advanced Very High Resolution Radiometer trend artifact from orbital drift discontinuity artifact from change in satellites Q: Examples of “Temporal Consistency” quality issues? ISO: Temporal Consistency=“correctness of the order of events” Start with ISO 19115/19157 Data Quality model, but...
Recommendation 2: Address More Dimensions of Quality • Accuracy: measurement bias + dispersion • Accuracy of data with low-quality flags • Accuracy of grid cell aggregations • Consistency: • Spatial • Temporal • Observing conditions
Recommendation #2 (cont.)More dimensions of quality • Completeness • Temporal: Time range, diurnal coverage, revisit frequency • Spatial: Coverage and Grid Cell Representativeness • Observing conditions: cloudiness, surface reflectance • N.B.: Incompleteness affects accuracy via sampling bias • AIRS dry sampling bias at high latitudes due to incompleteness in high-cloud conditions, which tend to have rain and convective clouds with icy tops • AIRS wet sampling bias where low clouds are prevalent
Quality Indicator: AOD spatial completeness (coverage) Average Percentage of Non-Fill Values in Daily Gridded Products MODIS Aqua MISR Due to a wider swath, MODIS AOD covers more area than MISR. The seasonal and zonal patterns are rather similar.
Quality Indicator: Diurnal Coverage for MODIS Terra in summer Probability (%) of an “Overpass*” in a Given Day *That is, being included in a MODIS L2 pixel during that hour of the day Local Hour of Day Because Terra is sun-synchronous with a 10:30 equator crossing, observations are limited to a short period during the day at all but high latitudes (Arctic in summer).
Recommendation 3: Address Fitness for Purpose Directly* *A bit controversial Standardize terms of recommendation Enumerate more positive realms and examples Enumerate negative examples
Recommendation #4: More Outreach... • ...Once we know what we want to say • Quality Screening: no longer any excuse not to for DQSS-served datasets • Should NASA supply DQSS for more datasets? • Quality Assessment: dependent on Recommendations 1-3 • Venues • Science team meetings...but for QC this is “preaching to the choir” • NASA Applied Remote Sensing Education and Training (ARSET): get them at the start of their NASA data usage! • Demonstrated DQSS and Aerostat to ARSET • Any others like ARSET? • Training workshops?
Lessons Learned • The tall pole is acquiring knowledge about what QC indicators really mean, and how they should be used. • Is anyone out there actually using the quality documentation? • Detailed analysis by DQSS of quality documentation turned up errors, ambiguities, inconsistencies, even an algorithm bug • Yet the help desks are not getting questions about these... • Seemed like a good idea at the time... • Visualizations: good for validating screening, but do users use them? • Hdf-java: not quite the panacea for portability we hoped • DQSS – OPeNDAP gateway: • OPeNDAP access to DQSS-screened data enables use by IDV /McIDAS-V • But it’s hard to integrate into a search interface • (Not giving up yet...)
Possible Client Side Concept GES DISC End User screening criteria Web Form XML File XML File Ontology Masker dataset-specific instance info data files data files Screener Data Provider
ESDSWG Activities • Contributions to all 3 TIWG subgroups • Semantic Web: • Contributed Use Case for Semantic Web tutorial @ ESIP • Participation in ESIP Information Quality Cluster • Services Interoperability and Orchestration • Combining ESIP OpenSearch with servicecasting and datacasting standards • Spearheading ESIP Federated OpenSearch cluster • 5 servers (2 more soon); 4+ clients • Now ESIP Discover cluster (see above) • Processes and Strategies: • Developed Use Cases for Decadal Survey Missions: DESDynI-Lidar, SMAP, and CLARREO
File-Level Quality Statistics are not always useful for data selection Study Area Percent Cloud Cover?
Level 3 grid cell standard deviation is difficult to interpret due to its dependence on magnitude Mean MODIS Aerosol Optical Thickness at 550 nm StandardDeviation
Neither pixel count nor standard deviation alone express how representative the grid cell value is MODIS Aerosol Optical Thickness at 0.55 microns Level 3 Grid AOT Mean Level 3 Grid AOT Standard Deviation 1 0 2 0.5 1 0 Level 3 Grid AOT Input Pixel Count Level 2 Swath 1 122