Download
1 / 30
300 likes | 562 Vues
Urban Air Quality Management Capability of Selected Asian Cities 2006 Update. Kong Ha Chairman Clean Air Initiative for Asian Cities. Strategic Policy Directions for Air Quality Risk Management/NERAM Colloquium. Sustainable Urban Mobility in Asia

E N D
Urban Air Quality Management Capability of Selected Asian Cities 2006 Update Kong Ha Chairman Clean Air Initiative for Asian Cities Strategic Policy Directions for Air Quality Risk Management/NERAM Colloquium Sustainable Urban Mobility in Asia A CAI-Asia Program
WHO (1979) TSP guideline, 60-90mg/m3 WHO SO2 guideline, 50mg/m3 WHO NO2 guideline, 40mg/m3 WHO (2005) PM10 guideline, 20mg/m3 Status of Air Quality in Asia • Ambient air quality in Asia is generally improving despite increase in motorization and energy use • Average ambient TSP, PM10 and SO2 trends are improving • Average ambient TSP and PM10, however, continue to exceed WHO and USEPA guidelines • Average ambient SO2 is in compliance with WHO guideline • NO2 close to guidelines • Insufficient information on O3 for reliable trend analysis • It is uncertain whether the observed improvements in air quality will be sustained Aggregated Annual Ambient AQ Trends, mg/m3 (1993 to 2005)
Annual Ambient Air Quality Standards for PM10 USEPA EU *No annual ambient air quality standards, only 24-hour limits
PM10 Annual Ambient Concentrations in Asian Cities (2005) WHO 2005 Guideline Value for Annual Average of PM10 = 20 µg/m3
PM10 Annual Ambient Concentrations in Asian Cities (2005) WHO 2005 PM10 Interim Target – 1 = 30 µg/m3
WHO 2005 PM10 Interim Target – 2 = 50 µg/m3 PM10 Annual Ambient Concentrations in Asian Cities (2005)
PM10 Annual Ambient Concentrations in Asian Cities (2005) WHO 2005 PM10 Interim Target – 3 = 70 µg/m3
Benchmarking Air Quality Management Capabilities in Asia • The Benchmarking study involved 20 cities in Asia representing various economic levels and geographic coverage. • The cities were categorized according to four AQM capability indices – 1) AQ measurement; 2) data availability and assessment; 3) emission estimates; and 4) AQ management enabling capacity. • Cities with high levels of economic development tend to have well-developed AQM systems • Benchmarking of AQM capability can assist cities in setting priorities and developing strategies for strengthening their AQM capability
Benchmarking UAQM Capability of Asian Cities Benchmarking Study Approach • In collaboration with Stockholm Environment Institute in their Air Pollution in the Megacities of Asia Project and the CAI-Asia Network City Profiles and AQ Data AQM Capability Questionnaire Compilation of information on current policy and practice for key components of AQM Questionnaire to assess AQM capability sent to city authorities
Air Quality Measurement Capabilities • Air Quality Measurement Index Assesses the ambient air monitoring taking place in a city and the accuracy and precision and representativeness of the data collected • Air Quality Data Assessment and Availability Index Assesses how air data is processed to value and provide information in a decision-relevant format. It also assesses the extent to which there is access to air quality information and data through different media • Emissions Estimate Index Assesses emission inventories undertaken to determine the extent to which decision-relevant information is available about source pollution in the city • Air Quality Management Index Asseses the administrative and legislative framework through which emission control strategies are introduced to manage air quality
Air Quality Measurement Index • Six cities measure the acute and chronic health effects for all criteria compounds (NO2, SO2, PM, CO, Pb, O3) • Nine cities measure trends in pollutant concentrations for all criteria compounds • Five cities measure the spatial distriubution for all compounds • 11 cities have the capacity to measure kerbside criteria for all compounds • Rigorous QA/QC criteria are applied in eight cities Minimal Limited Moderate Good Excellent
AQ Monitoring Capacity in Asia Air Quality Monitoring Stations Status of AQ monitoring in Asia Source: Urban Air Pollution in Asian Cities (2006) - for publication
Air Quality Assessment and Availability Index • 11 cities undertake prediction modelling for pollutants monitored • 11 cities have undertaken epidemiological studies • 10 cities issue air quality alerts • 9 cities undertake spatial mapping of pollutants • 11 cities formally publish AQ data Minimal Limited Moderate Good Excellent
Online Ambient Air Quality Data of Selected Asian Cities Online AQ Information
Emission Estimates Index • 14 cities have emission estimates for major source categories (industrial, mobile and domestic/commercial) • 15 cities have emission estimates for all criteria pollutants (PM, CO, SO2, NO2 and HC) • 8 cities have estimates of emissions based on actual measurements • 6 cities cross check estimates Minimal Limited Moderate Good Excellent
Air Quality Management Index • 11 cities have AQ standards for all criteria pollutants • 17 cities have emission limits and controls on stationary and mobile sources • 13 cities impose penalties for th exceedance of both stationary and mobile emissions Minimal Limited Moderate Good Excellent
Ambient Air Quality Standards in Asia • Most countries have more lenient standards than those prescribed by WHO and USEPA • Standards for PM10 have been largely based on USEPA limits • There is a need to review current PM standards – Europe has moved PM10 limit to 50µg/m3 limit for 24-hour averages and 40 µg/m3 for annual averages • Standards for other air toxics e.g benzene should be legislated • In some cases, AQ monitoring plans/ systems, are inconsistent with the established standards • most Asian countries do not have specific roadside AQM standards
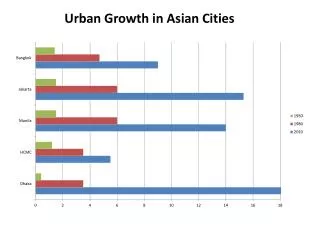
Vehicle Growth Forecast in Asian Countries(in Millions of Vehicles) China, P.R. India Thailand Indonesia Note: Vehicle Population Projection from Segment Y Ltd
Vehicle Emissions Standards • Compared to five years ago, more Asian countries have now adopted or have legislated plans to adopt stricter vehicle emissions standards as well as fuel standards • Emphasis has been on institutionalizing new vehicle emissions standards and not enough attention has been given in addressing emissions from in-use vehicles • More attention has been given as well to light-duty vehicles compared to heavy duty vehicles • One of the most pressing problem of Asian countries is the rapid increase in the motorcycle fleet but not enough attention has been given towards appropriate regulatory measures to control the associated emissions
Vehicle Emission Standards Note: For light-duty vehicles Source: CAI-Asia, 2006
Transportation and Land-use Planning • Land-use planning, perhaps the most powerful regulatory tool that can be used to address vehicular emissions, is seldom being used by most Asian countries • Governments and development institutions have started to place an increasing emphasis on urban transportation issues, particularly on public transportation • International organizations have acknowledged the direct relationship between climate change mitigation and the promotion of public transportation and have initiated several projects on this • Several countries in Asia have now started to develop sustainable urban transportation policies promoting public transportation, i.e. Bus-rapid transit • In China, the Vice Minister of Construction, Qui Baoxing, has ordered city authorities to improve and maintain cycling facilities and in to order to restore the country’s title as the "kingdom of bicycles"
Paradigm shift in urban & transportation planning (1) Seoul - Asia’s Big Dig The 6-lane Cheonggyecheon highway will soon be transformed into a riverscape
Paradigm shift in urban & transportation planning (2) • Nihonbashi, one of the main historic areas in Tokyo sits oppressed under an eight-lane expressway • It was once the point from which distances in Japan were measured • A government project is now looking at ways to restore Nihonbashi’s old look • The recommendation is to transfer 2km of the Tokyo Metropolitan Expressway underground and create space along the river for waterside life • The committee looking at this issue believe that restoring the Nihonbashi area's cityscape to its original state serves as a basic guideline for urban renewal plans to be put together in the future
China and India Urban Transportation Policy • Both China, P.R. and India have developed policies that call for the integration of transport system plans with urban development, equitable allocation of road space and increased investments on public transportation, including BRT, rail and non-motorized transportation: • The National Development and Reform Commission (NDRC) Guideline states that the 11th Five-Year Plan of China, P.R. which started in 2006 will prioritize the development of public transportation with mass rapid transit (MRT) as a key transport mode in mega cities. • The 2006 Indian National Urban Transport Policy vision is to “recognize that people occupy center-stage in our (Indian) cities and all plans would be for their common benefit and well being” i.e., invest on more on transport systems that encourage greater use of public transport and non-motorized modes instead of personal motor vehicles
Conclusions (1) • Despite considerable progress being made to clean the air in Asian cities, cost of air pollution to human health and environment remains high and public still perceive their air quality as worsening • The perceived failing of measures to manage urban air quality could weaken the willingness of the public and stakeholders to reduce emissions and to comply with air pollution regulations and could also discourage decision makers from taking action to improve air quality • The measures taken by the cities to improve their existing AQM capability will determine whether PM10 and NO2 levels can be reduced
Conclusions (2) • The identification of the stage of development in terms of AQM capability can assist cities in setting priorities and developing strategies to strengthen their AQM capability. • Cities with a relative low AQM capability need to focus on establishing or strengthening continuous air quality monitoring system and implementing basic control strategies • All cities will need to ensure that their AQM systems not only manage the traditional criteria pollutants such as CO, NOx, SO2, O3, TSP, and PM10 but also fine PM which is monitored as PM2.5 • In addition, all countries should review their air quality standards in view of the EU limit values and the new WHO guideline values
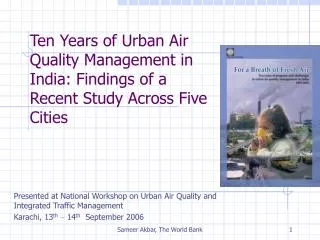
This volume is the most current and comprehensive assessment and comparison of the status and drivers of urban air pollution in 20 Asian cities and the Asian region, covering the effects on the environment, human health, agriculture and cultural heritage and the future implications for planning, transport and energy industries. The book will be formally launched during the Better Air Quality 2006 (http://www.baq2006.org) Workshop on 13-15 December 2006 in Yogyakarta, Indonesia. Cities covered: Bangkok, Beijing, Busan, Colombo, Dhaka, Hanoi, Ho Chi Minh City, Hong Kong, Jakarta, Kathmandu, Kolkata, Metro Manila, Mumbai, New Delhi, Seoul, Shanghai, Singapore, Surabaya, Taipei and Tokyo Published by Earthscan with the Stockholm Environment Institute, the Clean Air Initiative for Asian Cities, the Korean Environment Institute and UNEP. For PUBLICATION - Pre-order your copy today!http://shop.earthscan.co.uk/ProductDetails/mcs/productID/730
Conclusions (2) Contact: Kong Hakha@epd.gov.hkCornie Huizenga chuizenga@adb.org www.cleanairnet.org/caiasia