Download
1 / 30
300 likes | 649 Vues
Urban Air Quality Management Capability of Selected Asian Cities 2006 Update ... Strengthening the air quality management community in Asia. www.cleanairnet.org/caiasia ...

E N D
1. Urban Air Quality Management Capability of Selected Asian Cities 2006 Update
2. The GOOD NEWS is that ambient air concentrations are generally decreasing.
The BAD NEWS is that the levels, especially for TSP and PM10 still exceed WHO guidelines.
How this improvement can be sustained will depend on the AQM capabilities of the cities.The GOOD NEWS is that ambient air concentrations are generally decreasing.
The BAD NEWS is that the levels, especially for TSP and PM10 still exceed WHO guidelines.
How this improvement can be sustained will depend on the AQM capabilities of the cities.
4. PM10 Annual Ambient Concentrations in Asian Cities (2005)
5. PM10 Annual Ambient Concentrations in Asian Cities (2005)
6. PM10 Annual Ambient Concentrations in Asian Cities (2005)
7. PM10 Annual Ambient Concentrations in Asian Cities (2005)
8. Benchmarking Air Quality Management Capabilities in Asia Capacity to manage air quality is variable in Asia.
Capacity to manage air quality is variable in Asia.
9. Benchmarking UAQM Capability of Asian Cities In collaboration with Stockholm Environment Institute in their Air Pollution in the Megacities of Asia Project and the CAI-Asia Network The approach taken to provide an assessment of AQM in 20 Asian cities consists of
three components:
1. Assessment of city authorities AQM capabilities using a questionnaire survey
completed by city authorities;
2. Compilation of information on current policy and practice for key aspects of
AQM in the form of a City Profile; and
3. Comparative analysis based on current policy and practice and some general
recommendations to improve AQM in Asian cities.
The approach taken to provide an assessment of AQM in 20 Asian cities consists of
three components:
1. Assessment of city authorities AQM capabilities using a questionnaire survey
completed by city authorities;
2. Compilation of information on current policy and practice for key aspects of
AQM in the form of a City Profile; and
3. Comparative analysis based on current policy and practice and some general
recommendations to improve AQM in Asian cities.
10. Air Quality Measurement Index
Assesses the ambient air monitoring taking place in a city and the accuracy and precision and representativeness of the data collected
Air Quality Data Assessment and Availability Index
Assesses how air data is processed to value and provide information in a decision-relevant format. It also assesses the extent to which there is access to air quality information and data through different media
Emissions Estimate Index
Assesses emission inventories undertaken to determine the extent to which decision-relevant information is available about source pollution in the city
Air Quality Management Index
Asseses the administrative and legislative framework through which emission control strategies are introduced to manage air quality In order to assess the AQM capabilities of the 20 Asian cities the WHO/UNEP/MARC AQM capability index was used. The WHO/UNEP/MARC
study (1996) developed an AQM capability index with indicators to assess each component of capability. This AQM capability index questionnaire survey was applied to 20 major cities throughout the world and 64 major European cities (WHO/UNEP/MARC, 1996; EEA, 1998). The index provides a useful tool to identify deficiencies and to allow comparisons between cities at different stages of economic
development.
Four sets of indicators (indices) to represent the key components of AQM capability
were used:
Air quality management capacity index
Assesses the ambient air monitoring taking place in a city and the accuracy, precision and representativeness of the data collected.
2. Data assessment and availability index
Assesses how air quality data is processed to determine their value and how they are used to provide information in a decision-relevant format. It also assesses the extent to which there is access to air quality information and data through different media.
3. Emission estimates index
Assesses emission inventories undertaken to determine the extent to which decision-relevant information is available about the sources of pollution in the city.
4. Management enabling capabilities index
Assesses the administrative and legislative framework through which emission control strategies are introduced and implemented to manage air quality.In order to assess the AQM capabilities of the 20 Asian cities the WHO/UNEP/MARC AQM capability index was used. The WHO/UNEP/MARC
study (1996) developed an AQM capability index with indicators to assess each component of capability. This AQM capability index questionnaire survey was applied to 20 major cities throughout the world and 64 major European cities (WHO/UNEP/MARC, 1996; EEA, 1998). The index provides a useful tool to identify deficiencies and to allow comparisons between cities at different stages of economic
development.
Four sets of indicators (indices) to represent the key components of AQM capability
were used:
Air quality management capacity index
Assesses the ambient air monitoring taking place in a city and the accuracy, precision and representativeness of the data collected.
2. Data assessment and availability index
Assesses how air quality data is processed to determine their value and how they are used to provide information in a decision-relevant format. It also assesses the extent to which there is access to air quality information and data through different media.
3. Emission estimates index
Assesses emission inventories undertaken to determine the extent to which decision-relevant information is available about the sources of pollution in the city.
4. Management enabling capabilities index
Assesses the administrative and legislative framework through which emission control strategies are introduced and implemented to manage air quality.
14. Online Ambient Air Quality Data of Selected Asian Cities AQ Monitoring Reporting details, format and frequency are not uniform across Asia. Some cities have real-time data shared to the public. On the other hand, others only make use of data, after thorough QA/QC have been completed.AQ Monitoring Reporting details, format and frequency are not uniform across Asia. Some cities have real-time data shared to the public. On the other hand, others only make use of data, after thorough QA/QC have been completed.
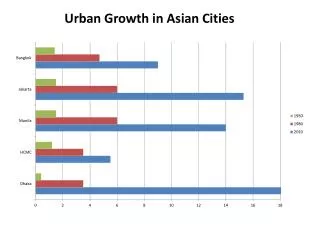
18. Motorization Trends in Asia
19. Motorization Trends in Asia
20. Forecast rationale for the vehicle fleet projections
The vehicle fleet projections used in this document were developed by Segment Y
Automotive Intelligence Pvt Ltd taking into consideration a number of criteria for each of the emerging markets in Asia. The expected growth in GDP per capita, in population, vehicle density per capita, vehicle density in relation to the road network, segment shifts driven by income and government policy, and acceleration in vehicle scrappage are all important elements in projecting future in-use vehicle populations.
Whilst for short term forecasts, vehicle sales are principally driven by the availability of credit, interest rates and fuel prices, other elements require deeper scrutiny over the longer term:
GDP per capita development: While the past may not be the best guide for the future, past performance was analyzed together with the projections presented in Goldman Sachs' "Dreaming with BRICs" report to arrive at plausible rates of GDP growth.
Population growth and vehicle density per capita: This GDP growth was combined with population growth forecasts based on UN projections and the assumption that as GDP grows, vehicle sales in emerging markets will follow similar trends to those in more developed markets and will rise for at least the next thirty years. The current vehicle density in these emerging markets is still very low; for example, the vehicle density in India is just 7 vehicles per 1000 persons, compared to 550 in Germany. Taking into account interest rates and retail prices, there is a broad correlation between development in GDP and vehicle populations. This applies both to passenger cars and motorcycles.
Vehicle density in relation to the road network: Infrastructure is also a driver, and whilst it is hard to predict changes over the long term there are clear pointers to the future, with countries like India and China investing substantially in comparison to, for example, Indonesia or the Philippines.
Better roads promote easy of transit and longer drives, which in turn leads to increased vehicle sales, higher mileages and earlier scrapping. Statistics on road networks were obtained from the United Nations Asian Highway Database.
Segment shifts driven by income and government policy: The future will see a number of changes in terms of segment shifts, driven by larger incomes, desire for safety and comfort and government regulations. City dwellers in Thailand are increasingly opting for smaller cars, and hence growth in the pickup segment will be more confined to the rural areas, but a lot of growth will come from those parts as the rural to urban gap narrows.
The Thai government is also toying with the idea to develop a second pillar of expertise in small cars, to reduce its dependency on oil imports. This will probably also contribute to a shift from pickups to small cars.
Income development also drives the shift from two-wheelers to cars. In most Asian countries, the point at which motorcycle sales start tailing off and cars sales increase is at a GDP per capita of around US$ 3,000 per annum. This point is yet to be reached in India and Indonesia, but China is getting close. What will accelerate this trend in China is the tendency to spend more on status symbols, in comparison to Indians for example, which tend to live more frugally.
This information is borne out by the sales statistics from the trade associations in the various countries and confirmed by motorcycle companies such as Yamaha and Honda.
Acceleration in scrappage: Another factor that is taken into consideration is the accelerated vehicle scrappage as markets mature. The average age in China is currently quite low, as so many vehicles have been added in recent years. The same applies in Indonesia, where record sales in recent years have substantially rejuvenated the current parc. In comparison, the parc in India is much older, as the sales have developed more gradually, and private vehicle ownership prolongs life through better maintenance.
Official scrappage statistics in Asia are generally unreliable, as records are not scrupulously maintained, and registered users generally have no incentive to report scrappage. Scrappage rates have therefore been derived from data from the Center for Transportation Analysis at the Oak Ridge National Laboratory in the US, the Society of Motor Manufacturers and Traders in the UK (SMMT), the Rijwiel- en Automobiel Instelling in the Netherlands (RAI), which is the Dutch equivalent of the SMMT, and the Japanese Automobile Manufacturers Association (JAMA).
Forecast rationale for the vehicle fleet projections
The vehicle fleet projections used in this document were developed by Segment Y
Automotive Intelligence Pvt Ltd taking into consideration a number of criteria for each of the emerging markets in Asia. The expected growth in GDP per capita, in population, vehicle density per capita, vehicle density in relation to the road network, segment shifts driven by income and government policy, and acceleration in vehicle scrappage are all important elements in projecting future in-use vehicle populations.
Whilst for short term forecasts, vehicle sales are principally driven by the availability of credit, interest rates and fuel prices, other elements require deeper scrutiny over the longer term:
GDP per capita development: While the past may not be the best guide for the future, past performance was analyzed together with the projections presented in Goldman Sachs' "Dreaming with BRICs" report to arrive at plausible rates of GDP growth.
Population growth and vehicle density per capita: This GDP growth was combined with population growth forecasts based on UN projections and the assumption that as GDP grows, vehicle sales in emerging markets will follow similar trends to those in more developed markets and will rise for at least the next thirty years. The current vehicle density in these emerging markets is still very low; for example, the vehicle density in India is just 7 vehicles per 1000 persons, compared to 550 in Germany. Taking into account interest rates and retail prices, there is a broad correlation between development in GDP and vehicle populations. This applies both to passenger cars and motorcycles.
Vehicle density in relation to the road network: Infrastructure is also a driver, and whilst it is hard to predict changes over the long term there are clear pointers to the future, with countries like India and China investing substantially in comparison to, for example, Indonesia or the Philippines.
Better roads promote easy of transit and longer drives, which in turn leads to increased vehicle sales, higher mileages and earlier scrapping. Statistics on road networks were obtained from the United Nations Asian Highway Database.
Segment shifts driven by income and government policy: The future will see a number of changes in terms of segment shifts, driven by larger incomes, desire for safety and comfort and government regulations. City dwellers in Thailand are increasingly opting for smaller cars, and hence growth in the pickup segment will be more confined to the rural areas, but a lot of growth will come from those parts as the rural to urban gap narrows.
The Thai government is also toying with the idea to develop a second pillar of expertise in small cars, to reduce its dependency on oil imports. This will probably also contribute to a shift from pickups to small cars.
Income development also drives the shift from two-wheelers to cars. In most Asian countries, the point at which motorcycle sales start tailing off and cars sales increase is at a GDP per capita of around US$ 3,000 per annum. This point is yet to be reached in India and Indonesia, but China is getting close. What will accelerate this trend in China is the tendency to spend more on status symbols, in comparison to Indians for example, which tend to live more frugally.
This information is borne out by the sales statistics from the trade associations in the various countries and confirmed by motorcycle companies such as Yamaha and Honda.
Acceleration in scrappage: Another factor that is taken into consideration is the accelerated vehicle scrappage as markets mature. The average age in China is currently quite low, as so many vehicles have been added in recent years. The same applies in Indonesia, where record sales in recent years have substantially rejuvenated the current parc. In comparison, the parc in India is much older, as the sales have developed more gradually, and private vehicle ownership prolongs life through better maintenance.
Official scrappage statistics in Asia are generally unreliable, as records are not scrupulously maintained, and registered users generally have no incentive to report scrappage. Scrappage rates have therefore been derived from data from the Center for Transportation Analysis at the Oak Ridge National Laboratory in the US, the Society of Motor Manufacturers and Traders in the UK (SMMT), the Rijwiel- en Automobiel Instelling in the Netherlands (RAI), which is the Dutch equivalent of the SMMT, and the Japanese Automobile Manufacturers Association (JAMA).
21. Compared to five years ago, more Asian countries have now adopted or have legislated plans to adopt stricter vehicle emissions standards as well as fuel standards
Emphasis has been on institutionalizing new vehicle emissions standards and not enough attention has been given in addressing emissions from in-use vehicles
More attention has been given as well to light-duty vehicles compared to heavy duty vehicles
One of the most pressing problem of Asian countries is the rapid increase in the motorcycle fleet but not enough attention has been given towards appropriate regulatory measures to control the associated emissions
22. Vehicle Emission Standards
23. Transportation and Land-use Planning Land-use planning, perhaps the most powerful regulatory tool that can be used to address vehicular emissions, is seldom being used by most Asian countries
Governments and development institutions have started to place an increasing emphasis on urban transportation issues, particularly on public transportation
International organizations have acknowledged the direct relationship between climate change mitigation and the promotion of public transportation and have initiated several projects on this
Several countries in Asia have now started to develop sustainable urban transportation policies promoting public transportation, i.e. Bus-rapid transit
In China, the Vice Minister of Construction, Qui Baoxing, has ordered city authorities to improve and maintain cycling facilities and in to order to restore the country�s title as the "kingdom of bicycles"
24. Paradigm shift in urban & transportation planning (1)
25. Nihonbashi, one of the main historic areas in Tokyo sits oppressed under an eight-lane expressway
It was once the point from which distances in Japan were measured
A government project is now looking at ways to restore Nihonbashi�s old look
The recommendation is to transfer 2km of the Tokyo Metropolitan Expressway underground and create space along the river for waterside life
The committee looking at this issue believe that restoring the Nihonbashi area's cityscape to its original state serves as a basic guideline for urban renewal plans to be put together in the future http://www.yomiuri.co.jp/dy/editorial/20060919TDY04006.htmhttp://www.yomiuri.co.jp/dy/editorial/20060919TDY04006.htm
26. China and India Urban Transportation Policy Both China, P.R. and India have developed policies that call for the integration of transport system plans with urban development, equitable allocation of road space and increased investments on public transportation, including BRT, rail and non-motorized transportation:
The National Development and Reform Commission (NDRC) Guideline states that the 11th Five-Year Plan of China, P.R. which started in 2006 will prioritize the development of public transportation with mass rapid transit (MRT) as a key transport mode in mega cities.
The 2006 Indian National Urban Transport Policy vision is to �recognize that people occupy center-stage in our (Indian) cities and all plans would be for their common benefit and well being� i.e., invest on more on transport systems that encourage greater use of public transport and non-motorized modes instead of personal motor vehicles
27. Conclusions (1) Despite considerable progress being made to clean the air in Asian cities, cost of air pollution to human health and environment remains high and public still perceive their air quality as worsening
The perceived failing of measures to manage urban air quality could weaken the willingness of the public and stakeholders to reduce emissions and to comply with air pollution regulations and could also discourage decision makers from taking action to improve air quality
The measures taken by the cities to improve their existing AQM capability will determine whether PM10 and NO2 levels can be reduced
28. Conclusions (2) The identification of the stage of development in terms of AQM capability can assist cities in setting priorities and developing strategies to strengthen their AQM capability.
Cities with a relative low AQM capability need to focus on establishing or strengthening continuous air quality monitoring system and implementing basic control strategies
All cities will need to ensure that their AQM systems not only manage the traditional criteria pollutants such as CO, NOx, SO2, O3, TSP, and PM10 but also fine PM which is monitored as PM2.5
In addition, all countries should review their air quality standards in view of the EU limit values and the new WHO guideline values
30. Conclusions (2)