Download
1 / 17
170 likes | 544 Vues
Integrating Geographical Information Systems and Grid Applications. Marlon Pierce ( mpierce@cs.indiana.edu ) Contributions: Ahmet Sayar, Galip Aydin, Mehmet Aktas, Harshawardhan Gadgil, Zhigang Qi Community Grids Lab Indiana University Project Funding: NASA AIST, ACCESS.

E N D
Integrating Geographical Information Systems and Grid Applications Marlon Pierce (mpierce@cs.indiana.edu) Contributions: Ahmet Sayar, Galip Aydin, Mehmet Aktas, Harshawardhan Gadgil, Zhigang Qi Community Grids Lab Indiana University Project Funding: NASA AIST, ACCESS
QuakeSim Project Overview • QuakeSim is a NASA funded collaboration of geophysicists and computer scientists to build cyber-infrastructure for geophysical research. • CI research and development includes • Portlet-based portals • AJAX enabled • Geographical Information System services • Application services to run codes.
QuakeSim Project Development Overview • Portlet-based portal components allow different portlets to be exchanged between projects. • Form-based portlets --> Interactive Maps • These are clients to Web services • Share with collaborators of REASoN portal. • Sensor Grid: Topic based publish-subscribe systems support operations on streaming data. • Web services allow request/response style access to data and codes. • GIS services (WMS, WFS) • “Execution grid” services for running codes: RDAHMM, ST_Filter • Use application specific WSDL on top of generic code management services. • GPS daily archive Web Services provided by Scripps.
Sensor Grid Overview • SensorGrid architecture supports access to both archived (databases), and real-time geospatial data through universal GIS standards and Web Service interfaces. • The architecture provides tools for coupling geospatial data with scientific data assimilation, analysis and visualization codes, such as: • Pattern Informatics • Virtual California • IEISS • RDAHMM
Input Signal Filter Output Signal Real-Time Services for GPS Observations • Real-time data processing is supported by employing filters around publish/subscribe messaging system. • The filters are small applications extended from a generic Filter class to inherit publish and subscribe capabilities.
Federating Map Servers Zao Liu, Marlon Pierce, Geoffrey Fox Community Grids Laboratory Indiana University
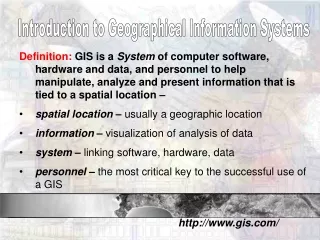
Integrating Map Servers • Geographical Information Systems combine online dynamic maps and databases. • Many GIS software packages exist • GIS servers around state of Indiana • ESRI ArcIMS and ArcMap Server (Marion, Vanderburgh, Hancock, Kosciusco, Huntington, Tippecanoe) • Autodesk MapGuide (Hamilton, Hendricks, Monroe, Wayne) • WTH Mapserver™ Web Mapping Application (Fulton, Cass, Daviess, City of Huntingburg) based on several Open Source projects (Minnesota Map Server) • Challenge: make 17 different county map servers from different companies work together. • 92 counties in Indiana, so potentially 92 different map servers.
Considerations • We assume heterogeneity in GIS map and feature servers. • GIS services are organized bottom-up rather than top-down. • Local city governments, 92 different county governments, multiple Indiana state agencies, inter-state (Ohio, Kentucky) consideration, federal government data providers (Hazus). • Must find a way to federate existing services. • We must reconcile ESRI, Autodesk, OGC, Google Map, and other technical approaches. • Must try to take advantage of Google, ESRI, etc rather than compete. • We must have good performance and interactivity. • Servers must respond quickly--launching queries to 20 different map servers is very inefficient. • Clients should have simplicity and interactivity of Google Maps and similar AJAX style applications.
Caching and Tiling Maps • Federation through caching: • WMS and WFS resources are queried and results are stored on the cache servers. • WMS images are stored as tiles. • These can be assembled into new images on demand (c. f. Google Maps). • Projections and styling can be reconciled. • We can store multiple layers this way. • We build adapters that can work with ESRI and OGC products; tailor to specific counties. • Serving images as tiles • Client programs obtain images directly from our tile server. • That is, don’t go back to the original WMS for every request. • Similar approaches can be used to mediate WFS requests. • This works with Google Map-based clients. • The tile server can re-cache and tile on demand if tile sections are missing.
Map Server Example Marion and Hancock county parcel plots and IDs are overlaid on IU aerial photographic images that are accessed by this mashup using Google Map APIs. We cache and tile all the images from several different map servers. (Marion and Hancock actually use different commercial software.)