Download
1 / 11
110 likes | 367 Vues
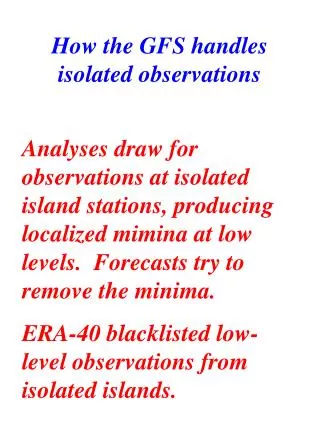
How the GFS handles isolated observations. Analyses draw for observations at isolated island stations, producing localized mimina at low levels. Forecasts try to remove the minima. ERA-40 blacklisted low-level observations from isolated islands. Skill of the GFS in the Tropics

E N D
How the GFS handles isolated observations Analyses draw for observations at isolated island stations, producing localized mimina at low levels. Forecasts try to remove the minima. ERA-40 blacklisted low-level observations from isolated islands.
Skill of the GFS in the Tropics Correlation of daily olr anomalies (from time mean) from GFS with daily olr anomalies from satellite Satellite data has gaps at equator; diurnal cycle not sampled as well as in GFS. Longitude-time plots averaged over 5S-5N; Correlations every 2.5 degrees. Day 3, GDAS correlated as well as satellite and GDAS. Skill in tropics less than in midlatitudes, but GFS analyses does pick up most of tropical variability.