Spreadsheets
Spreadsheets. Spreadsheets. Excel for Educators Class Notes A Workshop by Karen Work Richardson karen@wmburgweb.com. Find more Resources for Educators on the Web: http://www.wmburgweb.com/Resources/index.html. Spreadsheet Basics.

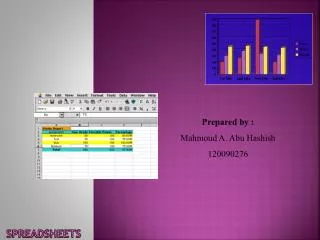
Spreadsheets
E N D
Presentation Transcript
Spreadsheets Spreadsheets Excel for Educators Class Notes A Workshop byKaren Work Richardsonkaren@wmburgweb.com Find more Resources for Educators on the Web: http://www.wmburgweb.com/Resources/index.html
Spreadsheet Basics Words to Know: •Spreadsheet •Column • Row • Cell • Cell Address • Used to organize and analyze information • Made up of columns and rows • Columns and rows intersect to form cells • Column letter plus row number makes cell address
Spreadsheet Basics Words to Know: •Spreadsheet •Column • Row • Cell • Cell Address Column A Column B Column C Row 1 Row 2 Row 3 A7 B4 C10 D5 Cells with addresses
Spreadsheet Basics Words to Know: •Entry Bar •Active Cell • Format • Alignment Entry Bar: Area where the text, number, or formula in the active cell is displayed. Also called the Formula Bar Active Cell: Cell in use, address shown beside formula bar Format: A change in the appearance of a value or label in a cell. In this example, cell A1 is bold. Cell D7 is formatted to display as a percentage. Alignment: The placement of information within a cell at the left edge, right edge, or centered. In this example, the cells in column A are centered. The cells in column B are right aligned.
Spreadsheet Basics Words to Know: •Cell range •Column width Column Heading Cell Range: A continuous group of selected cells. This range includes cells A1 through D10. Row Heading Column Width: Column widths may be varied to display data correctly. Tip: To select an entire column or row, click on the column or row heading.
Spreadsheet Formulas • A combination of values or cell references and mathematical operators • Mathematical Operators: + - * / • Formulas begin with an equal sign • The actual formula displays in the entry bar • The results of the formula display in the cell
Spreadsheet Formulas Words to Know: •Formula •Mathematical Operators Formula: Combination of values or cell references and mathematical operators such as +, -, /, * The formula displays in the entry bar. This formula is used to add the values in the four cells. The sum is displayed in cell B7. The results of a formula display in the cell.
Spreadsheet Formulas • Examples of formulas: • Add cells B4, C4, D4, and E4: =B4+C4+D4+E4 • Subtract cell F10 from cell F9: =F9-F10 • Multiply cells A3 and A4: =A3*A4 • Divide cell D5 by cell D6 =D5/D6 Always use cell references instead of values in your formulas! That way, when the values change the formulas gets updated.
Spreadsheet Functions • Functions are built-in shortcuts for making calculations with a range of cells: • Most common is SUM (used to add cells) • AUTOSUM button adds in one step • AVERAGE function finds the average by adding the numbers and dividing by the number of items • MIN function finds the minimum value in a range • MAX function finds the maximum value in a range
Spreadsheet Functions • Some Sample Functions • Add together cells B3 through B7 • =SUM(B3:B7) • Find the average of cells D4 through D8 • =AVERAGE(D4:D8) • Find the minimum value in the cell range E43:E52 • =MIN(E43:E52) • Find the maximum value in the cell range E43:E52 • =MAX(E43:E52)
AVERAGE Function • There are three ways to find the average of the cell range A1:A5: • =AVERAGE(A1:A5) • =(A1+A2+A3+A4+A5)/5 • =SUM(A1:A5)/5
The MEDIAN Function =MEDIAN(A1:A5) • The MEDIAN average is the number found in the middle of a sorted list: • $40,000$63,000$74,000$85,000$98,000 The median is $74,000 because it is in the middle of the list. $100,000 $110,000 $120,000 $160,000 $220,000 $240,000 The median is $140,000: the mean average of the two center numbers. ($120,000+$160,000)/2=$140,000
Functions In Action The SUM function is used to find the total of cells C3, C4, C5 and C6. The same calculation could be done using a mathematical operator: =C3+C4+C5+C6
Data Selected: B5-C6 Charts
Chart Wizard makes chart creation easy Select data to be displayed Use Ctrl key to select data that isn’t adjacent (ex. A2-A4 AND C3-C5) Chart is linked to worksheet data so it gets updated as data changes Charts
Axis Values: created from the worksheet data Category Names: column or row headings Series Names (legend): column or row headings Data Markers: Each data series shares a pattern Chart Parts, Part One
Chart Parts, Part Two • Each part can be formatted for font, style, or color • Can choose to display or not display legend • Chart Wizard previews your selections • Can make a column chart in one step by using default chart option
Data Series • A group of related data points that are plotted in a chart • Originate from rows or columns on a datasheet • Each data series in a chart has a unique color or pattern • You can plot one or more data series in a chart
Data Series Examples This spreadsheet has one data series in a column: Number of candies This spreadsheet has three data series in columns: Bag #1, Bag #2, and Bag #3 OR This spreadsheet has four data series in rows: Blue, Green, Red, Orange.
Data Series to Pie Chart The title comes from this cell. Each of the numbers become a slice of the pie. The legend and labels come from the first column.
Data Series to Bar Chart #1 The same set of data can yield two different bar charts if the data series are in rows or columns.
Data Series to Bar Chart #2 • Data Series in Rows • Each group of columns represents one bag. • Each column in the group is a color. • The colors are the DATA SERIES. They appear in the legend.
Data Series to Bar Chart #3 • Data Series in Columns • Each group of columns represents one color. • Each column in the group is a bag. • The bags are the DATA SERIES. They appear in the legend.
Pie Charts • Shows the proportional size of items that make up a data series to the sum of the items • Pie charts have only one data series
Chart Wizard Dialog Box Title and Axes Names As you enter information into the chart wizard, you see a preview of your chart.
Chart Wizard Dialog Box Axes Display Besides naming the axes, you can decide if you want categories and values to appear.
Chart Wizard Dialog Box Gridlines Your chart can have very simple or very complicated gridlines. I prefer very simple.
Chart Wizard Dialog Box Legend You can choose to have a legend and decide where it appears. For a chart like this one that only has one data series, a legend isn’t necessary.
Chart Wizard Dialog Box Values and Labels Labeling your data with the values can make your chart easier to interpret. When you make a pie chart, you can label the slices with both values and percentages.
Chart Wizard Dialog Box Data Table A data table appears at the bottom of your chart and shows the data in a table format.
Chart Wizard Dialog Box Embedded vs. Sheet You can have your chart appear on your sheet or on a new page of its own within the same spreadsheet.
Formatting Charts In general, you format chart parts by right clicking on them. In this slide, all four bars in the chart are selected (a data series) and any change made to one bar will be made to all bars.
Formatting Charts To format individual bars (data points), first select all bars, then click on one to select it. By right clicking, you can format that particular bar.
Formatting Charts This chart shows a variety of formatting choices.