microPET Experiences with Small Animal PET Imaging
microPET Experiences with Small Animal PET Imaging Simon R. Cherry, Ph.D. Crump Institute for Biological Imaging Dept. of Molecular and Medical Pharmacology UCLA School of Medicine, Los Angeles, California Supported by NCI grants CA 69370 CA 74036 and DOE contract FC03-87-ER60615

microPET Experiences with Small Animal PET Imaging
E N D
Presentation Transcript
microPETExperiences with Small Animal PET Imaging Simon R. Cherry, Ph.D. Crump Institute for Biological Imaging Dept. of Molecular and Medical Pharmacology UCLA School of Medicine, Los Angeles, California Supported by NCI grants CA 69370 CA 74036 and DOE contract FC03-87-ER60615
Outline • PET Basics • motivation for small animal PET • design & performance of a small animal PET scanner • applications for small animal PET
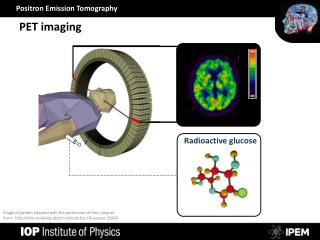
e+ e+ e+ e+ coincidence ? e– e+ Positron Emission Tomography positron scatters in tissue losing energy nucleus 511 keV yes 511 keV annihilation
Positron-Emitting Radionuclides Isotope Halflife + fraction Max. Energy range(mm) production C–11 20.4 mins 0.99 0.96 MeV 0.4 mm cyclotron N–13 9.96 mins 1.00 1.20 MeV 0.7 mm cyclotron O–15 123 secs 1.00 1.74 MeV 1.1 mm cyclotron F–18 110 mins 0.97 0.63 MeV 0.3 mm cyclotron Cu–62 9.74 mins 0.98 2.93 MeV 2.7 mm generator Cu-64 12.7 hours 0.19 0.65 MeV 0.3 mm cyclotron Ga–68 68.3 mins 0.88 1.83 MeV 1.2 mm generator Br-76 16.1 hours 1.00 1.90 MeV 1.2 mm cyclotron Rb–82 78 secs 0.96 3.15 MeV 2.8 mm generator I–124 4.18 days 0.22 1.50 MeV 0.9 mm cyclotron
PET-labeled Probes for Biological Imaging hemodynamic parameters (H215O, 15O-butanol, 11CO, 13NH3.....) substrate metabolism(18F-FDG, 15O2, 11C-palmitic acid....) protein synthesis (11C-leucine, 11C-methionine, 11C-tyrosine) enzyme activity (11C-deprenyl, 18F-deoxyuracil...) drugs (11C-cocaine, 13N-cisplatin, 18F-fluorouracil...) receptor affinity (11C-raclopride, 11C-carfentanil, 11C-scopalamine) neurotransmitter biochemistry (18F-fluorodopa, 11C-ephedrine...) gene expression (18F-penciclovir, 18F-antisense oligonucleotides...) ..................................... cyclotron 11C, 13N, 15O, 18F PET can detect and image sub nanomolar levels of these tracers in vivo
Human Whole-Body PET Scanners 18FDG - transaxial sections through brain Siemens ECAT EXACT HR+ 20,000 scintillator detectors ring diameter ~ 80 cm 4 mm (64 µL) spatial resolution (typically 6-12 mm in clinical practice)
0.0 mins 0.75 mins 1.25 mins 1.75 mins 2.25 mins 2.75 mins 4.5 mins 7.5 mins 10.5 mins 13.5 mins 20 mins 30 mins 40 mins 50 mins 60 mins 75 mins 95 mins 115 mins Time Course of 18F-FDOPA in the Brain
striatum cerebellum Tracer Kinetic Modeling • Simplified model for FDOPA kinetics in striatum • Rate constants K1, k2, k3 & k4 can be estimated using measured PET time activity curves and blood input function. K1 k4 k3 FDA and its metabolites tissue FDOPA plasma FDOPA clearance of 18F label to plasma k2 FDOPA = [18F]fluoroDOPA
Why Small Animal Imaging? • in vivo in vitro • non-destructive - repeat studies in the same animal • can efficiently survey whole animal • rapid in vivo screening? • provides bridge from animal studies to human studies • better decisions sooner!
In Vivo Small Animal Imaging Anatomic Physiologic Metabolic Molecular optical imaging x-ray CT PET/SPECT MRI MR Spectroscopy fMRI ultrasound
Which Imaging Technique? • what do you want to measure? • spatial resolution (µm or mm?) • temporal resolution (ms or mins?) • sensitivity (mM or nM?) • field of view (striatum or whole animal?) • what’s available
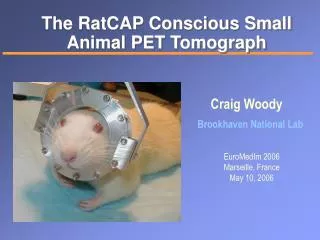
microPET • 30 detector modules • 1920 detector elements • ring diameter: 172 mm • axial field of view: 18 mm • spatial resolution: 1.8 mm (6 µL) • sensitivity: 200 cps/µCi (CFOV)
Small Animal PET Scanner Development • microPET (UCLA/Concorde Microsystems) • HIDAC (Oxford Positron Systems) • SHR-7700 (Hamamatsu, Japan) • Sherbrooke Animal PET (Sherbrooke, Canada) • RATPET (MRC Hammersmith) • TierPET (Jülich, Germany) • YAP-PET (Ferrara, Italy) • MAD-PET (Munich, Germany) • ANI-PET (Montreal, Canada)
microPET images baby monkey brain phantom (25 cc) Siemens EXACT HR+ microPET
18F-FDG Whole Body Rat Study microPET
18F-FDG Rat Heart microPET
MicroPET images of rat myocardium (13NH3) Short Axis Vertical long Axis Horizontal long Axis Baseline Occlusion Reperfusion Polar Map T. Kudo, A.J. Annala and H. Schelbert
Comparison of Metabolic Images FCx Caud/Put PCx Thal TCx FDG autoradiography Bs FDG microPET Amy Moore, David Hovda, Simon Cherry UCLA Crump Institute for Biological Imaging & Division of Neurosurgery
Quantitative FDG-microPET microPET 120 microPET autoradiography 100 autoradiography 80 CMRGlc (mol/100g/min) 60 40 20 Amy Moore, David Hovda, Simon Cherry UCLA Crump Institute for Biological Imaging & Division of Neurosurgery 0 Frontal Cx Caudate/ Putamen Parietal Cx Thalamus
CMRGlc Following Traumatic Brain Injury Baseline 2 days post-injury 75 CMRGlc 5 days post-injury 0 10 days post-injury Rat #383 Amy Moore, David Hovda, Sheri Osteen, Simon Cherry UCLA Crump Institute for Biological Imaging & Division of Neurosurgery
Lesioned Striatum Lesioned Striatum Rat Striatal Dopamine System Imaged with microPET [C-11]WIN 35,428 DA Transporter Binding [C-11]Raclopride DA D2 Receptor Binding Control Unilateral 6-Hydroxydopamine Lesion Dan Rubins, Goran Lacan, Simon Cherry, andWilliam Melega
Mouse Brain:11C-WIN 35,428 Time Activity curve 30g mouse transverse brain section 180µCi of 11C-WIN 35,428 (0.018µg)
C6 LS174T Liver MicroPET Tumor Imaging 64Cu-DOTA anti-CEA Minibody • Athymic mouse with LS174T (CEA+) and C6 (CEA-) xenografts • Injected with 70 µCi 64Cu-anti-CEA minibody (engineered antibody fragment, scFv-CH3 ) • Scanned 12 hr post injection Data courtesy of Anna Wu (UCLA and City of Hope)
PET in Drug Development • direct radiolabeling of drug • biodistribution and pharmacokinetics • binding/competition studies • dosing and pharmacodynamics • indirect markers • pharmacodynamic effect on secondary marker (e.g. metabolism or blood flow)
Positron Emission Tomography Advantages: vast range of biological processes can be measured quantitatively sensitivity can be in nM to pM range whole animal biodistribution and kinetics Disadvantages: relatively coarse spatial (~mm) and temporal (~mins) sampling synthesis of radiolabeled compounds can be a bottleneck little or no anatomical information
MR Compatible PET System Concept Animal MR system PET Detectors MR Receiver Coil
Prototype MR Compatible PET Scanner 56 mm ring diameter 72 2x2x25 mm LSO scintillators PMT’s optical fibers
Experimental Setup Prototype MR compatible PET scanner inside 1.5T clinical MR
Simultaneous In Vivo Imaging 200 g Rat - 18F-FDG Brain Study PET MRI 1.3 mCi 18F-FDG imaging time 30 mins slice thickness ~ 2mm TE=12 msec, TR=280 msec continuous 75 secs acquisitions during PET study slice thickness 4 mm
microCT microPET Rapid In Vivo Drug and Genetic Screening with PET and CT combined anatomical & molecular imaging for use with 18F-labeled ligands or secondary markers such as 18F- FDG throughput of >20 mice per hour sophisticated bioinformatics to assist in analysis conveyor belt
References Chatziioannou AF, Cherry SR, Shao Y, Silverman RW, Meadors K, Farquhar TH, Pedarsani M, Phelps ME. Performance evaluation of microPET: A high resolution LSO PET scanner for animal imaging. J Nucl Med 40: 1164-1175 (1999). Gambhir SS, Barrio JR, Herschman HR, Phelps ME. Assays for Non-Invasive Imaging of Reporter Gene Expression. Nuclear Medicine and Biology, 26: 481-490 (1999). MacLaren DC, Gambhir SS, Satyamurthy N, Barrio JR, Sharfstein S, Toyokuni T, Wu L, Berk AJ, Cherry SR, Phelps ME, Herschman HR. Repetitive, Non-invasive Imaging of the Dopamine D2 Receptor as a Reporter Gene in Living Animals. Gene Therapy, 6:785-791 (1999). Gambhir SS, Barrio JR, Phelps ME, Iyer M, Namavari M, Satyamurthy N, Wu L, Green LA, Bauer E, MacLaren DC, Nguyen K, Berk AJ, Cherry SR, Herschman HR. Imaging Adenoviral-Directed Reporter Gene Expression in Living Animals with Positron Emission Tomography. Proc Natl Acad Sci (USA), 96: 2333-2338 (1999).
Acknowledgments Imaging Sciences Lab: Andrew Goertzen Andrew Wang Daniel Rubins Arion Chatziioannou Yiping Shao Yuan-Chuan Tai Robert Silverman Randal Slates Niraj Doshi Collaborators: Richard Leahy (USC) Jinyi Qi (LBNL) Concorde Microsystems Inc. UCLA: Sam Gambhir Harvey Herschman Michael Phelps Amy Moore David Hovda Harley Kornblum Heinrich Schelbert William Melega Takashi Kudo Alexander Annala Anna Wu