Download
1 / 51
510 likes | 783 Vues
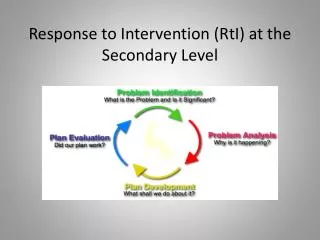
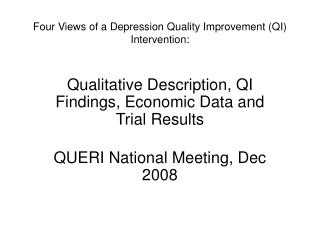
Four Views of a Depression Quality Improvement (QI) Intervention: . Qualitative Description, QI Findings, Economic Data and Trial Results QUERI National Meeting, Dec 2008. What is TIDES? (Translating Initiatives in Depression into Effective Solutions).

E N D
Four Views of a Depression Quality Improvement (QI) Intervention: Qualitative Description, QI Findings, Economic Data and Trial Results QUERI National Meeting, Dec 2008
What is TIDES?(Translating Initiatives in Depression into Effective Solutions) • 1990’s: Researchers tested depression care improvement models • Collaborative care with care management necessary and sufficient (over 36 high quality randomized trials) • 2000: TIDES = Can VA implement collaborative care as part of routine care? • VISN leadership were decision-makers • 2006: TIDES part of national VA rollout
TIDES is An Evidence-Based Quality Improvement Project • Design based on successive Plan-Do-Study-Act Cycles (PDSA) • Starting point for PDSA’s is evidence from the literature • VISN leaders decided on general program features through an expert panel process • Regional and local team-based quality improvement process was flexible and variable
Qualitative and Quantitative Evaluations of TIDES • A series of projects with PI’s/CoPIs including • Ed Chaney, Fen Liu (Seattle) • JoAnn Kirchner, Rick Owen, Mona Ritchie (Little Rock) • John Williams (Durham) • Lisa Rubenstein, Becky Yano, Jackie Fickel, Susan Vivell (GLA) • Clinical Leaders Randy Petzel, Mike Davies, Cathy Henderson, Clyde Parkis, Susan McCutcheon, Skye McDougal, Ken Clark, Ron Norby, and many others
A C C O U N T A B I L I T Y T I D E S W A V E S C O V E S R I P P L E RET I D E S H I T I D E S QUERI Water PIPELINE Revise Guidelines Depression Care Guidelines Depression Collaborative Care Model PIC, MHAP, MOOD,IMPACT, RESPECT, TEAM Implementation Science Implementation Policy HSR
This Session • Presentations: • Jackie Fickel—Initial TIDES sites at baseline • Fen Liu---Key aspects of implementation and their costs • Ed Chaney—The story of a randomized trial • Lisa Rubenstein—TIDES QI data • Discussion: • Do different views of the elephant enrich understanding? • Implications of TIDES for VA and for your work?
Clinic-level Usual Care for Depression in Primary Care Settings Jacqueline Fickel, PhD, Elizabeth Yano, PhD, Louise Parker, PhD, Lisa Rubenstein, MD --VA Sepulveda HSR&D Center of Excellence QUERI National Meeting, December 11, 2008
Clinic-level Assessment • Usual care process • Concordance with evidence-based guidelines • Barriers
Methods • Cross-sectional observation prior to a multi-site intervention: collaborative care model for depression in primary care clinics • Case comparison strategy • 10 VA primary care clinics, from 3 networks • In-depth, semi-structured interviews with 22 clinical leaders • Supplemental descriptive, organizational structure data, for context
Results: General similarities across sites, but also particular processes specific to each clinic • Usual care processes • 3 clinics rarely diagnosed or treated depression • Differences from guidelines • Assessment limited, informal diagnostic methods and decisions for locus of care, treatment options mostly pharmacologic • Barriers to appropriate management of patients with depression in PC • Zero to six barriers cited per clinic
How research team can work with clinic staff • Care process, especially whether already diagnosing and/or treating depression in primary care • Awareness of barriers • Nature of barriers
Closest of typical care process to guidelines + Typical barriers
Most variations from typical care process + Unusual barriers
Implications • Define individual clinics’ situations prior to QI interventions • Insights regarding how to tailor interventions • Keep in mind for insights on interpretation of evaluation results
Organizational Cost of Quality Improvement for Depression Chuan-Fen Liu, PhD MPH VA Norwest HSR&D Center of Excellence December 11, 2008
Objectives • Document implementation timelines • Estimate organization cost of implementing TIDES models
Study Design • Cross-sectional descriptive analysis from April 2000 to June 2004 • Study Sites: 7 TIDES intervention clinics • QI participants: clinical and technical expert support teams • Activities included: communications, meetings, protocols and materials development, training, and other activities to facilitate the process • Activities excluded: usual patient care, evaluation and research, Human Subjects Review • Data Sources: project records and surveys
Phases of Quality Improvement Process First Contact Date Expert Panel Date Site Visit Date TIDES1 Implementation Date PDSA Cycle Routine Care BasicDesign Practice Engagement Preparation 6 months 6 months Implementation Design 1Date of first patient referral
Preparation and Design Phases • The length of design phase decreased with the order of initiation across VISNs: 20 months; 19 months; 12 months
Conclusions • Clinical partners contributed more people, but less time • As planned, clinical partners served as decision makers, the technical expert team carried out the majority of the labor • Creation of a successful depression care model required significant resources
Depression Quality Improvement Through the Lens of a Randomized Clinical Trial Intent to Treat Versus Treating the IntentEdmund Chaney PhD Northwest HSR&D COE QUERI National Meeting, Dec 2008
What was WAVES?(Well-being Among Veterans Enhancement Study) Site level randomized trial of TIDES In each of 3 early adopter VISNs two small to medium sized CBOCs were randomized to TIDES and one to usual care. Subject Recruitment: Population-based research telephone depression screening Identified consenting depressed patients were referred to DCM at TIDES sites TIDES was implemented as QI at each site and was stable prior to WAVES referrals
WAVES Design Designed to test treatment adherence Antidepressant use and psychotherapy visits assessed based on administrative data at 7 months Health outcomes were assessed by survey at 7 months (72% completion)
WAVES Results Significantly increased antidepressant use, adherence Non-significant improvement in overall appropriate care Adherent to medications (MPR > .8) or at least 4 MHS visits No significant improvement in depression symptoms or functional status
What Happened? Trials vs. QI Delayed start due to IRB: TIDES close to capacity when WAVES started Plan: TIDES Plan-Do-Study-Act cycles with no more than 50 patients prior to WAVES start Primary care provider-referred patients “competed” with research nurse-referred patients Research patients received lower priority Primary care provider experience level affected effectiveness of the model Few WAVES PCP’s were experienced
Intervention Sites373 patients DCM Assessment62%(n=232) WAVES Referral Outcome (Triage) No Assessment38%(n=141) PC Mean DCM Contacts2.9(n=152)SD=1.0 MH Mean DCM Contacts1.8 (n=80)SD=0.7 Mean DCM Contacts1.357%(n=80)SD=0.5 Refusedtreatment41%(n=58) Note: MH patients are those who were in Mental Health Care when referred to TIDES.
What Happened: Regional Differences One of three VISNs had a weaker program Patient health and adherence outcomes significantly worse for this VISN (p < .05) Little VISN Director level back-up Care manager turnover with inadequate replacement
Lessons from WAVES: Trials May Not Reflect Real World Implementation Real world interventions are implemented through some type of quality improvement method Interventions only sustain if integrated into organization’s real world activities Difficult to use trials to study QI implementation without distortion Trial can’t capture some strong determinants of real world program functioning E.g., primary care provider preferences and experience determine use of the treatment model
Lessons from WAVES: Trials Reflect Outcome Determinants The outcome impacts of weakness in one of three VISNS Shows program is sensitive to leadership & turnover Effects of TIDES on a representative sample Shows importance of assessing who is getting the program Can enable fine-tuning of factors such as provider engagement
What, When, Why and How are Essential for Implementation Research SQUIRE criteria codify reporting Multiple methods are necessary E.g., TIDES QI Registry, site readiness data helped to interpret WAVES outcome Distinctions between QI Implementation and effectiveness research need to be better understood
TIDES Quality Improvement Findings: Patient Care and Outcomes Lisa V. Rubenstein, MD, MSPH QUERI National Meeting, Dec 2008
Purpose of TIDES QI Data • Assess • Patient safety and effectiveness for those referred to the model • Adherence to evidence-based DCM model • Focus for improvement • Assess quality variations across clinics • Develop TIDES performance measures
What is This Data? • Many possible names • Formative evaluation • Quality improvement • Patient safety • What it isn’t: Comparative Effectiveness
Methods • Care managers trained to • Administer PHQ-9 in standardized way • Record panel management & results on a log • Transfer log data to Excel • Excel spreadsheets (de-identified) sent to research team for analysis • Spans 1/2002 to 9/2004 (21 months) • Crosses many PDSA cycles
Results #1: Enrollment & F/U • Among 858 pts referred to TIDES, 738 (87%) were eligible for initial assessment • 24 refused (2.8%) • 86 could not be contacted (10%) • 10 misc. (e.g., too sick) (1%) • Of 738 eligibles, 86% (636) got a full initial assessment by the DCM • 81% of these (516) completed 6 mos.PHQ f/u
#2: Depression Symptom Outcomes • PHQ 9 > 10 = probable major depression • PHQ 9 < 5 = probably no significant depression • Baseline PHQ 9 mean = 12.2 • F/u PHQ 9 at 24 weeks = 7.4 ___________________________________ • Mean pre-post drop in PHQ 9 = 5.8 points
#3: Mean PHQ Change: Referral Type (TIDES vs WAVES) • P=.002, controlling for baseline PHQ, VISN, pt complexity, interactions • Interactions not significant (VISN, pt complexity)
#4: Mean PHQ Change: VISNs (includes TIDES and WAVES pts) • P=.02, controlling for referral type, pt complexity, int. • No significant interactions (referral type, pt complexity)
#5:Contact New Referrals Promptly • 81% enrolled within 1 month (48% in 1 wk) • TIDES referral: 81 % enrolled in 1 month • WAVES referral: 74% enrolled in 1 month • VISN #1: 91% • VISN #2: 81% • VISN #3: 78%
#6: Enrollment and f/u calls • Mean enrollment calls/pt = 3.7 • TIDES and WAVES were equivalent • Proportion of pts completing adequate TIDES care (at least 4 treatment contacts) was significantly lower for WAVES-referred pts (p = .01) • Pts receiving at least 4 calls had significantly better outcomes (p < .05)
TIDES QI Formative Findings: Reach • Reach: • Clinics varied from 46% to 100% of clinicians who referred to TIDES at least once; 0% to 36% who referred at least 10 pts • Sustainability: • Least ready site performed, but did not sustain (in a favorable VISN) • Most ready site did not perform or sustain (in an unfavorable VISN)
Could We Have Predicted Success? • VISN effects seemed to trump individual site effects (positive and negative) • “Most ready” site from Fickel data was in the lowest performing VISN • “Least ready” site was in the best performing VISN • Care managers were at the VISN level • Lowest VISN leadership support linked to lowest care manager support
Conclusions • TIDES was safe and effective for the majority of those referred to it • TIDES model performance echoes literature • TIDES QI measures show progress and room for improvement • QI measures for evidence-based depression care models is critical • Assessment of site and VISN readiness may help future TIDES-Type implementation