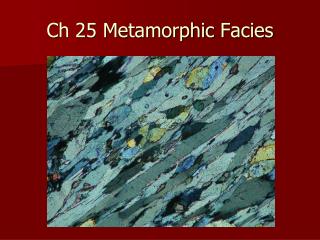
Chapter 26: Metamorphic Reactions
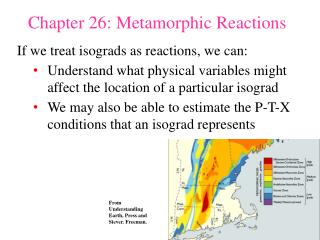
Chapter 26: Metamorphic Reactions. If we treat isograds as reactions, we can: Understand what physical variables might affect the location of a particular isograd We may also be able to estimate the P-T-X conditions that an isograd represents.

Chapter 26: Metamorphic Reactions
E N D
Presentation Transcript
Chapter 26: Metamorphic Reactions If we treat isograds as reactions, we can: Understand what physical variables might affect the location of a particular isograd We may also be able to estimate the P-T-X conditions that an isograd represents From Understanding Earth, Press and Siever. Freeman.
1. Phase Transformations Isochemical Polymorphs of SiO2 or Al2SiO5 or graphite-diamond or calcite-aragonite Simplest: depend on temperature and pressure only
1. Phase Transformations Figure 26.1. A portion of the equilibrium boundary for the calcite-aragonite phase transformation in the CaCO3 system. After Johannes and Puhan (1971), Contrib. Mineral. Petrol., 31, 28-38. Winter (2010) An Introduction to Igneous and Metamorphic Petrology. Prentice Hall.
1. Phase Transformations Figure 26.15. The P-T phase diagram for the system Al2SiO5 showing the stability fields for the three polymorphs andalusite, kyanite, and sillimanite. Calculated using the program TWQ (Berman, 1988, 1990, 1991). Winter (2010) An Introduction to Igneous and Metamorphic Petrology. Prentice Hall.
1. Phase Transformations Small DS for most polymorphic transformations small DG between two alternative polymorphs, even several tens of degrees from the equilibrium boundary little driving force for the reaction to proceed ® common metastable relics in the stability field of other Coexisting polymorphs may therefore represent non-equilibrium states (overstepped equilibrium curves or polymetamorphic overprints)
2. Exsolution Figure 6.16. T-X phase diagram of the system albite-orthoclase at 0.2 GPa H2O pressure. After Bowen and Tuttle (1950). J. Geology, 58, 489-511. Winter (2010) An Introduction to Igneous and Metamorphic Petrology. Prentice Hall.
3. Solid-Solid Net-Transfer Reactions Involve solids only Differ from polymorphic transformations: involve solids of differing composition, and thus material must diffuse from one site to another for the reaction to proceed
3. Solid-Solid Net-Transfer Reactions Examples: NaAlSi2O6 + SiO2 = NaAlSi3O8 Jd Qtz Ab MgSiO3 + CaAl2Si2O8 = CaMgSi2O6 + Al2SiO5 En An Di And 4 (Mg,Fe)SiO3 + CaAl2Si2O8 = Opx Plag (Mg,Fe)3Al2Si3O12 + Ca(Mg,Fe)Si2O6 + SiO2 Gnt Cpx Qtz
Figure 27-1. Temperature-pressure phase diagram for the reaction: Albite = Jadeite + Quartz calculated using the program TWQ of Berman (1988, 1990, 1991). Winter (2010) An Introduction to Igneous and Metamorphic Petrology. Prentice Hall.
3. Solid-Solid Net-Transfer Reactions If minerals contain volatiles, the volatiles must be conserved in the reaction so that no fluid phase is generated or consumed For example, the reaction: Mg3Si4O10(OH)2 + 4 MgSiO3 = Mg7Si8O22(OH)2 Tlc En Ath involves hydrous phases, but conserves H2O It may therefore be treated as a solid-solid net-transfer reaction
Discontinuous reaction: f + 1 and XLiq fixed 3. Solid-Solid Net-Transfer Reactions When solid-solution is limited, solid-solid net-transfer reactions are discontinuous reactions Discontinuous reactions tend to run to completion at a single temperature (at a particular pressure) There is thus an abrupt (discontinuous) change from the reactant assemblage to the product assemblage at the reaction isograd
4. Devolatilization Reactions Among the most common metamorphic reactions H2O-CO2 systems are most common, but the principles same for any reaction involving volatiles Reactions dependent not only upon temperature and pressure, but also upon the partial pressure of the volatile species
4. Devolatilization Reactions For example the location on a P-T phase diagram of the dehydration reaction: KAl2Si3AlO10(OH)2 + SiO2 = KAlSi3O8 + Al2SiO5 + H2O Ms Qtz Kfs Sill W depends upon the partial pressure of H2O (pH2O) This dependence is easily demonstrated by applying Le Châtelier’s principle to the reaction at equilibrium
4. Devolatilization Reactions The equilibrium curve represents equilibrium between the reactants and products under water-saturated conditions (pH2O = PLithostatic) Figure 26.2(a). P-T phase diagram for the reaction Ms + Qtz = Kfs + Al2SiO5 + H2O showing the shift in equilibrium conditions as pH2O varies (assuming ideal H2O-CO2 mixing). Calculated using the program TWQ by Berman (1988, 1990, 1991). After Winter (2010) An Introduction to Igneous and Metamorphic Petrology. Prentice Hall.
KAl2Si3AlO10(OH)2 + SiO2 = KAlSi3O8 + Al2SiO5 + H2O Ms Qtz Kfs Sill W Suppose H2O is withdrawn from the system at some point on the water-saturated equilibrium curve: pH2O < Plithostatic According to Le Châtelier’s Principle, removing water at equilibrium will be compensated by the reaction running to the right, thereby producing more water This has the effect of stabilizing the right side of the reaction at the expense of the left side So as water is withdrawn the Kfs + Sill + H2O field expands slightly at the expense of the Mu + Qtz field, and the reaction curve shifts toward lower temperature
Figure 26.2. P-T phase diagram for the reaction Ms + Qtz = Kfs + Al2SiO5 + H2O showing the shift in equilibrium conditions as pH2O varies (assuming ideal H2O-CO2 mixing). Calculated using the program TWQ by Berman (1988, 1990, 1991). Winter (2010) An Introduction to Igneous and Metamorphic Petrology. Prentice Hall.
4. Devolatilization Reactions pH2O can become less than PLith by either of two ways Pfluid < PLith by drying out the rock and reducing the fluid content Pfluid = PLith, but the water in the fluid can become diluted by adding another fluid component, such as CO2 or some other volatile phase In Fig. 26.2 I calculated the curves for the latter case on the basis of ideal H2O-CO2 mixing
4. Devolatilization Reactions An important point arising from Fig. 26.2 is: The temperature of an isograd based on a devolatilization reaction is sensitive to the partial pressure of the volatile species involved An alternative: T-Xfluid phase diagram Because H2O and CO2 are by far the most common metamorphic volatiles, the X in T-X diagrams is usually the mole fraction of CO2 (or H2O) in H2O-CO2 mixtures Because pressure is also a common variable, a T‑Xfluid diagram must be created for a specified pressure
4. Devolatilization Reactions Figure 26.4. T-XH2O phase diagram for the reaction Ms + Qtz = Kfs + Sil + H2O at 0.5 GPa assuming ideal H2O-CO2 mixing, calculated using the program TWQ by Berman (1988, 1990, 1991). Winter (2010) An Introduction to Igneous and Metamorphic Petrology. Prentice Hall.
4. Devolatilization Reactions Figure 26.4. Winter (2010) An Introduction to Igneous and Metamorphic Petrology. Prentice Hall. Figure 26.2. Winter (2010) An Introduction to Igneous and Metamorphic Petrology. Prentice Hall.
4. Devolatilization Reactions Shape of ~ all dehydration curves on T-Xfluid diagrams is similar to the curve in Fig. 26.2 Maximum temperature at the pure H2O end, and slope gently at high XH2O, but steeper toward low XH2O, becoming near vertical at very low XH2O Reaction temperature can thus be practically any temperature below the maximum at pH2O = Plith Must constrain the fluid composition (if possible) before using a dehydration reaction to indicate metamorphic grade
A rare exception Figure 26.3. Calculated P-T equilibrium reaction curve for a dehydration reaction illustrating the full loop that is theoretically possible. From Winter (2010). An Introduction to Igneous and Metamorphic Petrology, Prentice Hall.
4. Devolatilization Reactions Decarbonation reactions may be treated in an identical fashion For example, the reaction: CaCO3 + SiO2 = CaSiO3 + CO2 (26.6) Cal Qtz Wo Can also be shown on a T-XCO2 diagram Has the same form as reaction (26.5), only the maximum thermal stability of the carbonate mineral assemblage occurs at pure XCO2
4. Devolatilization Reactions Figure 26.5. T-XCO2 phase diagram for the reaction Cal + Qtz = Wo + CO2 at 0.5 GPa assuming ideal H2O-CO2 mixing, calculated using the program TWQ by Berman (1988, 1990, 1991). Winter (2010) An Introduction to Igneous and Metamorphic Petrology. Prentice Hall. P-T phase diagram for the reaction Cal + Qtz = Wo + CO2
5 types of devolatilization reactions, each with a unique general shape on a T-X diagram Type 3: Tmax at XCO2 determined by the stoichiometric ratio of CO2/H2O produced Ca2Mg5Si8O22(OH)2 + 3 CaCO3 + 2 SiO2 Tr Cal Qtz = 5 CaMgSi2O6 + 3 CO2 + H2O Di Figure 26.6. Schematic T-XCO2 phase diagram illustrating the general shapes of the five types of reactions involving CO2 and H2O fluids. After Greenwood (1967). In P. H. Abelson (ed.), Researches in Geochemistry. John Wiley. New York. V. 2, 542-567. Winter (2010) An Introduction to Igneous and Metamorphic Petrology. Prentice Hall.
5. Continuous Reactions Figure 26.8. Geologic map of a hypothetical field area in which metamorphosed pelitic sediments strike directly up metamorphic grade. From Winter (2010) An Introduction to Igneous and Metamorphic Petrology. Prentice Hall.
5. Continuous Reactions Two possible reasons: 1. Such contrasting composition that the garnet reaction is different Example: garnet in some pelites may be created by the (unbalanced) reaction: Chl + Ms + Qtz Grt + Bt + H2O (26.11) Whereas in more Fe-rich and K-poor pelites, garnet might be generated by an (unbalanced) reaction involving chloritoid: Chl + Cld + Qtz Grt + H2O (26.12)
5. Continuous Reactions 2. The reaction on which the isograd is based is the same in each unit, but it is a continuous reaction, and its location is sensitive to the composition of the solutions (either solid of fluid) involved The offsets this creates in an isograd are usually more subtle than for reason #1, but in some cases they can be substantial We will concentrate on this second reason here
5. Continuous Reactions Fig. 6.10. Isobaric T-X phase diagram at atmospheric pressure After Bowen and Shairer (1932), Amer. J. Sci. 5th Ser., 24, 177-213. Winter (2010) An Introduction to Igneous and Metamorphic Petrology. Prentice Hall. “Melt-in” isograd?
5. Continuous Reactions Discontinuous reactions occur at a constant grade Chl + Ms + Qtz Grt + Bt + H2O (26.11) in KFASH F = C – f + 2 = 5 – 4 + 2 = 1
5. Continuous Reactions If Chl + Ms + Qtz Grt + Bt + H2O (26.11) in KFMASH were a continuous reaction, then we would find chlorite, muscovite, quartz, biotite, and garnet all together in the same rock over an interval of metamorphic grade above the garnet-in isograd The composition of solid solution phases vary across the interval, and the proportions of the minerals changes until one of the reactants disappears with increasing grade
Continuous reactions occur when F 1, and the reactants and products coexist over a temperature (or grade) interval Fig. 26.9a.Schematic isobaric T-XMg diagram representing the simplified metamorphic reaction Chl + Qtz Grt + H2O. From Winter (2010) An Introduction to Igneous and Metamorphic Petrology. Prentice Hall.
Pseudosections address (only) the reactions (continuous or discontinuous) affecting a rock of specific Xbulk Fig. 26.9b.Schematic P-T “pseudosection” for a specific bulk composition (in this case for Mg/(Mg + Fe) = 0.5 and quartz-excess) showing the stability fields of Chl + Qtz, Chl + Grt + Qtz, and Grt + Qtz. Note the continuous nature of the reaction when all solid phases are present (shaded area). Note also that one can contour the shaded divariant field in (b) for specific compositions of either garnet (as has been done) or chlorite. The boundaries and contours would change for a different Xbulk (i.e. different XMg), and even the field assemblages might change: for example the higher temperature garnet + quartz field would be garnet + chlorite if the SiO2 content were so low that quartz were consumed before chlorite by the reaction. From Winter (2010) An Introduction to Igneous and Metamorphic Petrology.
6. Ion Exchange Reactions • Reciprocal exchange of components between 2 or more minerals • MgSiO3 + CaFeSi2O6 = FeSiO3 + CaMgSi2O6 • Annite + Pyrope = Phlogopite + Almandine • Expressed as pure end-members, but really involves Mg-Fe (or other) exchange between intermediate solutions • Basis for many geothermobarometers • Causes rotation of tie-lines on compatibility diagrams
Figure 27.6. AFM projections showing the relative distribution of Fe and Mg in garnet vs. biotite at approximately 500oC (a) and 800oC (b). From Spear (1993) Metamorphic Phase Equilibria and Pressure-Temperature-Time Paths. Mineral. Soc. Amer. Monograph 1. MSA. Winter (2010) An Introduction to Igneous and Metamorphic Petrology. Prentice Hall.
6. Redox Reactions • Involves a change in oxidation state of an element • 6 Fe2O3 = 4 Fe3O4 + O2 • 2 Fe3O4 + 3 SiO2 = 3 Fe2SiO4 + O2 • At any particular pressure these becomeoxygen buffers Fig. 26.10.Isobaric T-fO2 diagram showing the location of reactions (26.13) - (26.15) used to buffer oxygen in experimental systems. After Frost (1991), Rev. in Mineralogy, 25, MSA, pp. 469-488. Winter (2010) An Introduction to Igneous and Metamorphic Petrology. Prentice Hall.
7. Reactions Involving Dissolved Species • Minerals plus ions neutral molecules dissolved in a fluid • One example is hydrolysis: • 2 KAlSi3O8 + 2 H+ + H2O = Al2Si2O5 (OH)4 + SiO2 + 2 K+ Kfs aq. species kaolinite aq. species • Can treat such reactions in terms of the phase rule and the intensive variables: P, T, and concentrations of the reactant species • T-P diagrams for fixed or contoured Ci • Isobaric T-Ci diagrams • Isobaric and isothermal Ci - Cj diagrams • Reaction above might be handled by a T vs. CK+/CH+ diagram
Reactions and Chemographics • Any two phases in a binary system can react to from a phase between them We can use chemographics to infer reactions • Fo + Qtz = En Mg2SiO4 + SiO2 = Mg2Si2O6 • En + Per = Fo Mg2Si2O6 + 2 MgO = 2 Mg2SiO4 • Per + Qtz = Fo or En • If we know the chemographics we can determine that a reaction is possible (and can dispense with balancing it)
Reactions and Chemographics What reaction does this ternary system allow? Fig. 26.12. From Winter (2010) An Introduction to Igneous and Metamorphic Petrology. Prentice Hall.
Reactions and Chemographics above x-in isograd A + B + C = X below x-in isograd
Reactions and Chemographics What reaction does this system allow? Fig. 26.13. From Winter (2010) An Introduction to Igneous and Metamorphic Petrology. Prentice Hall.
A compatibility diagram for some metamorphic zone Reactions and Chemographics What reaction is possible between A-B-C-D? Fig. 26.14a. From Winter (2010) An Introduction to Igneous and Metamorphic Petrology. Prentice Hall.
Below the isograd Fig. 26.14. From Winter (2010) An Introduction to Igneous and Metamorphic Petrology. Prentice Hall. A + B = C + D At the isograd Above the isograd This is called a tie-line flip, and results in new groupings in the next metamorphic zone
Petrogenetic Grids Petrogenetic grid for mafic rocks P-T diagrams for multicomponent systems that show a set of reactions, generally for a specific rock type Fig. 26.19.Simplified petrogenetic grid for metamorphosed mafic rocks showing the location of several determined univariant reactions in the CaO-MgO-Al2O3-SiO2-H2O-(Na2O) system (“C(N)MASH”). Winter (2010) An Introduction to Igneous and Metamorphic Petrology. Prentice Hall.
Text figures that I don’t have time to cover in my 1-semester class Fig. 26.7.T-XCO2 phase diagram fro 2 reactions in the CaO-MgO-SiO2-H2O-CO2 system at 0.5 GPa, assuming ideal mixing of non-ideal gases, calculated using the program TWQ by Berman (1988, 1990, 1991). Winter (2010) An Introduction to Igneous and Metamorphic Petrology. Prentice Hall.
Text figures that I don’t have time to cover in my 1-semester class Figure 26.15. The Al2SiO5 T-P phase diagram from Figure 21-9 (without H2O). Winter (2010) An Introduction to Igneous and Metamorphic Petrology. Prentice Hall.
Text figures that I don’t have time to cover in my 1-semester class Figure 26.16. Schematic one-component T-P phase diagram showing the topology of a four-phase multisystem in which all invariant points are stable. Because only three phases (C+2) coexist at an invariant point, a complete system should have four invariant points, each with one phase absent. Phases absent at invariant points are in square brackets, phases absent for univariant reactions are in parentheses. Winter (2010) An Introduction to Igneous and Metamorphic Petrology. Prentice Hall.
Text figures that I don’t have time to cover in my 1-semester class Figure 26.17. A portion of the P-T phase diagram for SiO2 (Figure 6-6) showing two stable invariant points [Trd] and [Liq] and two metastable ones. [b-Qtz] occurs at negative pressure, and [Crs] is truly metastable in that it is the intersection of metastable extensions. From Spear (1993) Metamorphic Phase Equilibria and Pressure-Temperature-Time Paths. Mineral. Soc. Amer. Monograph 1. MSA.
Text figures that I don’t have time to cover in my 1-semester class Figure 26.18.a. Hypothetical reaction D + E = F in a two-component phase diagram. Note that the D-absent and E-absent curves must both lie on the side of the initial univariant curve opposite to the field in which D + E is stable. Likewise the F-absent curve must lie on the side opposite to the field in which F is stable. b. A second hypothetical univariant curve (D-absent) is added. c. The complete topology of the invariant point can then be derived from the two initial reactions in (b). The chemographics may then be added to each divariant field. Winter (2010) An Introduction to Igneous and Metamorphic Petrology. Prentice Hall.
Figure 26.20.a. Sketch from a photomicrograph showing small crystals of kyanite (purple) and quartz (blue) in a larger muscovite grain (green). Small crystals of fibrolitic sillimanite also occur in the muscovite. Glen Cova, Scotland. b. Sillimanite needles in quartz (blue) embaying muscovite (green). Pink crystals are biotite. Donegal, Ireland. After Carmichael (1969).Contrib. Mineral. Petrol., 20, 244-267.