Download
1 / 50
510 likes | 1.91k Vues
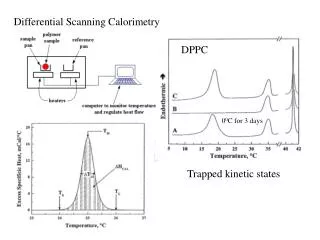
Differential Scanning Calorimetry (DSC). By: Muhammad Haseeb Iqbal National Textile University. Calorimetry. Calorimetry is the analytical method of measuring the heat emitted and/or absorbed during thermodynamic transitions or chemical reactions .

E N D
Differential Scanning Calorimetry (DSC) By: Muhammad HaseebIqbal National Textile University
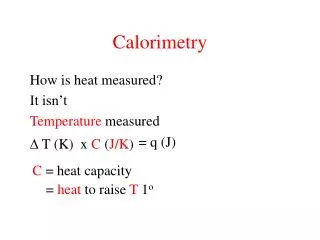
Calorimetry • Calorimetry is the analytical method of measuring the heat emitted and/or absorbed during thermodynamic transitions or chemical reactions. • Heat, internal energy and work of a closed system are related by the following thermodynamic relations: Q = U −W H = U + PV Where; Q is the heat U is the internal energy W is the work performed on the system H is the enthalpy P is the pressure V is system volume
Differential Scanning Calorimetry • This technique is used to study what happens to polymers/samples upon heating • A Calorimeter measures heat in or out of a sample • A differential calorimeter measures the heat of a sample relative to a reference • Differential Scanning Calorimetry (DSC) measures the amount of heat absorbed or emitted by a system as well as by a “reference” sample undergoing heating and/or cooling cycles in a controlled atmosphere. • Endothermic: heat flows into the sample • Exothermic: heat flows out of the sample • Both the sample and reference are maintained at nearly the same temperature through out the experiment in DSC • The technique was developed by E.S. Watson and M.J. O'Neill in 1962 and introduced commercially at the Pittsburgh Conference on Analytical Chemistry and Applied Spectroscopy in 1963
A Differential Scanning Calorimetryis a technique in which the heat flux (power) to the sample is monitored against time or temperature while temperature of sample, in specified environment, is programmed. (ICTA nomenclature committee) • In practice, the difference in heat flux to a pan containing a sample and an empty pan is monitored. • These measurements provide quantitative and qualitative information about physical and chemical changes in a material. • The utility of DSC comes from the fact that all changes in structure involve the absorption or release of heat.
What can DSC measure • Transition Temperatures • Glass Transitions • Melting/Crystallinity (J/g not %) • Crystallization Time and Temperature • Polymorphic Transformation/Stability • Drug-Excipient Incompatibility • Protein Denaturation • Thermal/Oxidative Stability • Boiling Points • Purity
Principle • It is a technique in which the energy necessary to establish a zero temperature difference between the sample & reference material is measured as a function of temperature • Here, sample & reference material are heated by separate heaters in such a way that their temp are kept equal while these temp. are increased or decreased linearly. • During heating two types of reactions can be take place one is the endothermic and the other is the exothermic.
Endothermic and exothermiceffects • According to the thermal transformation, an endothermic or exothermiceffectisrecorded Endothermiceffect: • In the case of an endothermiceffect, itisneeded to provideheat to the system for its transformation. This willresult in a decrease of the temperature in the system during the transformation. • In endothermic reaction more energy needed to maintain zero temp difference between sample & reference. • Among the mostcommonendothermiceffects: • melting, sublimation • first order and second order phase transitions • evaporation, dehydration • denaturation (protein) • gelatinization (starchwith water) • Pyrolysis • There is a particularendothermic transition, called glass transition, thatis not giving a peak.
Exothermiceffects: • In the case of an exothermiceffect, the system providesheatduringits transformation. This results in an increase of the temperature in the system. • In exothermic reaction, less energy needed to maintain zero temp difference between sample & reference. • Among the mostcommonexothermiceffects: • Crystallization • Gelation (gel formation) • Oxidation, combustion • Decomposition, ignition, explosion • Fermentation • Most of the chemicalreactions • Polymerization, reticulation
What happens to a polymer upon heating? • The polymer is heated in a device that looks something like this:
There are two pans, In sample pan, polymer is added, while the other, reference pan is left empty • Each pan sits on top of heaters which are controlled by a computer • The computer turns on heaters, and let them heat the two pans at a specific rate. • The computer makes absolutely sure that the heating rate stays exactly the same throughout the experiment
Why heaters don’t heat at the same rate? • The simple reason is that the two pans are different. One has polymer in it, and one doesn't. The polymer sample means there is extra material in the sample pan. Having extra material means that it will take more heat to keep the temperature of the sample pan increasing at the same rate as the reference pan • So the heater underneath the sample pan has to work harder than the heater underneath the reference pan. It has to put out more heat.
Differential Scanning CalorimetryInstrument Types • Two basic types of DSC instruments: • power compensation DSC • heat-flux DSC Power compensation DSC Heat flux DSC
Power Compensation DSC • The power compensating DSC has nearly two identical (in term of heat losses) measuring cells, one for the sample and one reference holder. • Both cells are heated with separate heaters, their temperatures are measured with separate sensors. • The temperature of both can be linearly varied as a function of time being controlled by an average temperature-control loop. A second differential control loop adjusts the power input as soon as temperature difference starts to occur due to some endothermic and exothermic process in the sample • The differential power signal is recorded as a function of the actual sample temperature.
Heat-flux DSC • One single heater is used in heat flux DSC to increase the temperature of both sample cell and reference cell. • Small temperature differences occurring due to endothermic/exothermic effects in the sample are recorded as a function of programmed temperature
DSC Calibration • Baseline • Evaluation of the thermal resistance of the sample and reference sensors • Measurements over the temperature range of interest • 2-Step process • The temperature difference of two empty crucibles is measured • The thermal response is then acquired for a standard material, usually sapphire, on both the sample and reference platforms • Amplified DSC signal is automatically varied with the temperature to maintain a constant calorimetric sensitivity with temperature
Temperature • Goal is to match the melting onset temperatures indicated by the furnace Thermocouple readouts to the known melting points of standards analyzed by DSC • Should be calibrated as close as possible to the desired temperature range • Heat flow • Use of calibration standards of known heat capacity, such as sapphire, slow accurate heating rates (0.5–2.0 °C/min), and similar sample and reference pan weights
Metals • Indium • Stannous • Aluminum • Inorganics • KNO3 • KClO4 • Organics • Polystyrene • Benzoic acid • Anthracene • Calibrants • High purity • Accurately known enthalpies • Thermally stable • Light stable (hʋ) • Non-hygroscopic • Un-reactive (pan, atmosphere)
Sample Preparation • Accurately-weigh samples (~3-20 mg) • Small sample pans (0.1 mL) of inert or treated metals (Al, Pt, Ni, etc.) • Several pan configurations, e.g., open, pinhole, or hermetically-sealed (airtight) pans • The same material and configuration should be used for the sample and the reference • Material should completely cover the bottom of the pan to ensure good thermal contact
Pt alumina Al Ni Cu quartz • Avoid overfilling the pan to minimize thermal lag from the bulk of the material to the sensor * Small sample masses and low heating rates increase resolution
DSC Curve • The result of a DSC experiment is a curve of heat flux versus temperature or versus time. There are two different conventions: exothermic reactions in the sample shown with a positive or negative peak, depending on the kind of technology used in the experiment. • This curve can be used to calculate enthalpies of transitions, which is done by integrating the peak corresponding to a given transition. The enthalpy of transition can be expressed using equation: ΔH = KA
Where ΔH is the enthalpy of transition, • K is the calorimetric constant, • A is the area under the peak. • The calorimetric constant varies from instrument to instrument, and can be determined by analyzing a well-characterized material of known enthalpies of transition. • Area under the peak is directly proportional to heat absorbed or evolved by the reaction, • Height of the peak is directly proportional to rate of the reaction
Factors affecting DSC curve Two types of factors effect the DSC curve 1-Instrumental factors a- Furnace heating rate b- Recording or chart speed c- Furnace atmosphere d- Geometry of sample holder/location of sensors e- Sensitivity of the recoding system f-Composition of sample containers
2-Sample characteristics a- Amount of sample b- Nature of sample c- Sample packing d- Solubility of evolved gases in the sample e- Particle size f- Heat of reaction g- Thermal conductivity
Determination of Heat Capacity • DSC plot can be used to determine Heat Capacity. Suppose a polymer is being heated. When we start heating two pans, the computer will plot the difference in heat output of the two heaters against temperature that is plot of heat absorbed by the polymer against temperature. The plot will look like this at first.
The heat flow is heat (q) supplied per unit time (t), whereas, • The heating rate is temperature increase (ΔT) per unit time (t)
By dividing heat flow (q/t)by the heating rate (ΔT/t). It ends up with heat supplied divided by the temperature increase, which is called heat capacity. • When a certain amount of heat is transferred to the sample, its temperature increases by a certain amount, and the amount of heat it takes to get a certain temperature increase is called the heat capacity, or Cp, itcan be figured up from the DSC plot
The Glass Transition Temperature • On further heating the polymer to a certain temperature, plot will shift downward suddenly, like this:
This means there is more heat flow. There is an increase in the heat capacity of the polymer. This happens because the polymer has just gone through the glass transition. Because of this change in heat capacity that occurs at the glass transition, we can use DSC to measure a polymer's glass transition temperature. • Take note that this change doesn't occur suddenly, but takes place over a temperature range. This makes picking one discreet Tg a kind of tricky matter, but we usually just take the middle of the incline to be the Tg.
Crystallization • After glass transition, the polymers have a lot of mobility. They wiggle and squirm, and never stay in one position for very long time. But when they reach the right temperature, they will give off enough energy to move into very ordered arrangements, which is called crystals. • When polymers fall into these crystalline arrangements, they give off heat. When this heat is dumped out, it makes the little computer-controlled heater under the sample pan really happy. It's happy because it doesn't have to put out much heat to keep the temperature of the sample pan rising. You can see this drop in the heat flow as a big peak in the plot of heat flow versus temperature
The temperature at the highest point in the peak is usually considered to be the polymer's crystallization temperature, or Tc
Also, we can measure the area of the peak, which tells us the latent energy of crystallization of the polymer • But most importantly, this peak tells us that the polymer can in fact crystallize • If you analyze a 100% amorphous polymer, like polystrene, you wouldn't get this peak, because such materials don't crystallize • Also, because the polymer gives off heat when it crystallizes, we call crystallization is an exothermic transition
Melting • If we heat our polymer past its Tc, eventually we'll reach another thermal transition, called melting. When we reach the polymer's melting temperature, Tm, the polymer crystals begin to fall apart, that is they melt. It comes out of their ordered arrangements, and begin to move around freely that can be spotted on a DSC plot
Remember, the heat which polymer give off when crystallized is absorbed when reached at Tm. That is a latent heat of melting like latent heat of crystallization. When the polymer crystals melt, they must absorb heat in order to do so. Remember melting is a first order transition. This means that at the melting temperature, the polymer's temperature won't rise until all the crystals have melted.
This means that the little heater under the sample pan has to put a lot of heat into the polymer in order to both melt the crystals and keep the temperature rising at the same rate as that of the reference pan. This extra heat flow during melting shows up as a big dip on DSC plot, like this:
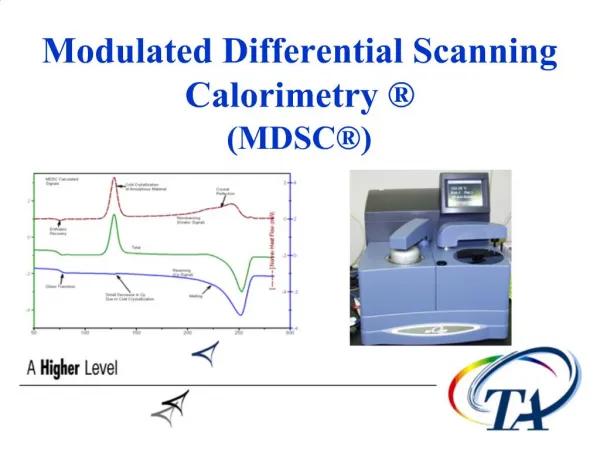
Putting It All Together • we saw a step in the plot when the polymer was heated past its glass transition temperature. Then we saw a big peak when the polymer reached its crystallization temperature. Then finally we saw a big dip when the polymer reached its melting temperature. To put them all together, a whole plot will often look something like this:
Of course, not everything you see here will be on every DSC plot. The crystallization peak and the melting dip will only show up for polymers that can form crystals and melts. • Completely amorphous polymers won't show any crystallization, or any melting either. But polymers with both crystalline and amorphous domains, will show all the features
From DSC plot you can see a big difference between the glass transition and the other two thermal transitions, crystallization and melting. For the glass transition, there is no dip, and there's no peak, either. This is because there is no latent heat given off, or absorbed, by the polymer during the glass transition. Both melting and crystallization involve giving off or absorbing heat.
The only thing we do see at the glass transition temperature is a change in the heat capacity of the polymer. • Because there is a change in heat capacity, but there is no latent heat involved with the glass transition, we call the glass transition a second order transition. Transitions like melting and crystallization, which do have latent heats, are called first order transitions
How much crystallinity? • DSC can also tell us how much of a polymer is crystalline and how much is amorphous? • If we know the latent heat of melting, ΔHm, we can figure out the answer. • The first thing we have to do is to measure the peak area for the melting of a polymer. Since, DSC curve is a plot of heat flow per gram of material, versus temperature. • Heat flow (heat given off per second), so the area of the peak is given in units of heat x temperature x time-1 x mass-1 (joules x kelvins x (seconds)-1 x (grams)-1
It can get simpler. We usually divide the area by the heating rate of dscexperiment. The heating rate is in units of K/s. So the expression becomes simpler:
Now we have a number of joules per gram. But because we know the mass of the sample, we can make it further simpler. We just multiply this by the mass of the sample: Now we just calculate the total heat put on when the polymer melted. If we do the same calculation for peak on the DSC plot for the crystallization of the polymer, we can get the total heat absorbed by the heater during the crystallization. We'll call the heat total heat of melting Hm, total, and total heat of the crystallization Hc, total. Now we're going to subtract the two:
H' is the heat absorbed by that part of the polymer which was already in the crystalline state before we heated the polymer above the Tc. We want to know how much of the polymer was crystalline before the experiment. That's why we subtract the heat given off at crystallization. • From H' we can figure up the percent crystallinity. It is divided by the specific heat of melting, Hm* which is the amount of heat absorbed by 1 g of a polymer. H' is in joules, and the specific heat of melting is usually given in joules per gram, so the answer in grams, that is called mc
This is the total amount of grams of polymer that were crystalline below the Tc. Now if we divide this number by the weight of our sample, mtotal, we get the fraction of the sample that was crystalline, and then of course, the percent crystallinity:
Liquid crystals • DSC is used in the study of liquid crystals. Some materials go from solid to liquid, they go through a third state, which displays properties of both the phases. This anisotropic liquid is known as a liquid crystalline state or mesomorphous state. Using DSC, it is possible to observe the small energy changes that occur as matter transitions from a solid to a liquid crystal and from a liquid crystal to anisotropic liquid.
Oxidative stability • To study the stability to oxidation of samples generally requires an airtight sample chamber. Usually, such tests are done isothermally (at constant temperature) by changing the atmosphere of the sample. First, the sample is brought to the desired test temperature under an inert atmosphere, usually nitrogen. Then, oxygen is added to the system. Any oxidation that occurs is observed as a deviation in the baseline. Such analysis can be used to determine the stability and optimum storage conditions for a material or compound.
Drug analysis • DSC is widely used in the pharmaceutical and polymer industries. For polymers, DSC is a handy tool for studying curing processes, which allows the fine tuning of polymer properties. The cross-linking of polymer molecules that occurs in the curing process is exothermic, resulting in a peak in DSC curve that usually appears soon after the glass transition. • In the pharmaceutical industry it is necessary to have well-characterized drug compounds in order to define processing parameters. For instance, if it is necessary to deliver a drug in the amorphous form, it is desirable to process the drug at temperatures below which crystallization can occur.
General chemical analysis • Melting-point depression can be used as a purity analysis tool when analysed by Differential scanning calorimetry. This is possible because the temperature range over which a mixture of compounds melts is dependent on their relative amounts. Consequently, less pure compounds will exhibit a broadened melting dip that begins at lower temperature than a pure compound.
Polymers • DSC is used widely for examining polymers to check their composition. Melting points and glass transition temperatures for most polymers are available from standard compilations, and the method can show up possible polymer degradation by the lowering of the expected melting point, which depends on the molecular weight of the polymer, so lower grades will have lower melting points than the expected. • Impurities in polymers can be determined by examining thermograms for anomalous peaks, and plasticizers can be detected at their characteristic boiling points.
Food science • In food science research, DSC is used in conjunction with other thermal analytical techniques to determine water dynamics. Changes in water distribution may be correlated with changes in texture.