Download
1 / 44
780 likes | 2.08k Vues
DSC: Differential Scanning Calorimetry A bulk analytical technique. What Does a DSC Measure?. A DSC measures the difference in heat flow rate (mW = mJ/sec) between a sample and inert reference as a function of time and temperature. Endothermic Heat Flow. Heat Flow

E N D
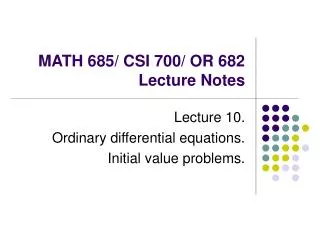
DSC: Differential Scanning Calorimetry A bulk analytical technique
What Does a DSC Measure? A DSC measures the difference in heat flow rate (mW = mJ/sec) between a sample and inert reference as a function of time and temperature
Endothermic Heat Flow • Heat Flow • Endothermic: heat flows into the sample as a result of either heat capacity (heating) or some endothermic process (glass transition, melting, evaporation, etc.)
Exothermic Heat Flow • Heat Flow • Exothermic: heat flows out of the sample as a result of either heat capacity (cooling) or some exothermic process (crystallization, cure, oxidation, etc.)
Temperature • What temperature is being measured and displayed by the DSC? • Sensor Temp: used by most DSCs. It is measured at the sample platform with a thermocouple (transducer), thermopile (series of thermocouples) or PRT (Platinum Resistance Thermometers)
Temperature • What temperature is being measured and displayed by the DSC? • Pan Temp: calculated by TA Q1000 based on pan material and shape • Uses weight of pan, resistance of pan, & thermoconductivity of purge gas • What about sample temperature? • The actual temperature of the sample is never measured by DSC
Temperature • What other temperatures are not typically being displayed? • Program Temp: the set-point temperature is usually not recorded. It is used to control furnace temperature • Furnace Temp: usually not recorded. It creates the temperature environment of the sample and reference
Understanding DSC Signals Heat Flow • Relative Heat Flow: measured by many DSCs. The absolute value of the signal is not relevant, only absolute changes are used. • Absolute Heat Flow: used by TA’s Q1000. Dividing the signal by the measured heating rate converts the heat flow signal into a heat capacity signal
Tzero Heat Flow Equation Heat Flow Sensor Model Besides the three temperatures (Ts, Tr, T0); what other values do we need to calculate Heat Flow? How do we calculate these?
Measuring the C’s & R’s • Tzero™ Calibration calculates the C’s & R’s • Calibration is a misnomer, THIS IS NOT A CALIBRATION, but rather a measurement of the Capacitance (C) and Resistance (R) of each DSC cell • After determination of these values, they can be used in the Four Term Heat Flow Equation showed previously
Measuring the C’s & R’s • Preformed using Tzero™ Calibration Wizard • Run Empty Cell • Run Sapphire on both Sample & Reference side
Measuring the C’s & R’s Empty DSC constant heating rate Assume: Heat balance equations give sensor time constants
Measuring the C’s & R’s Repeat first experiment with sapphire disks on sample and reference (no pans) Assume: Use time constants to calculate heat capacities
Measuring the C’s & R’s Use time constants and heat capacities to calculate thermal resistances
A few words about the Cs and Rs • The curves should be smooth and continuous, without evidence of noise or artifacts • Capacitance values should increase with temperature (with a decreasing slope) • Resistance values should decrease with temperature (also with a decreasing slope) • It is not unusual for there to be a difference between the two sides, although often they are very close to identical
Bad Tzero™ Calibration Run Can see that it is bad during Tzero™ cal run
Before Running Tzero™ Calibration • System should be dry • Dry the cell and the cooler heat exchanger using the cell/cooler conditioning template and the default conditions (2 hrs at 75°C) with the cooler off • Preferably enable the secondary purge • Do not exceed 75°C cell temperature with the cooler off, although the time can be extended indefinitely
Stabilization before Calibration • System must be stable before Tzero™ Calibration • Stabilization is achieved by cycling the baseline over the same temperature range and using the same heating rate as will be used for the subsequent calibration • Typical systems will stabilize after 3-4 cycles, 8 cycles recommended to ensure that the system has stabilized
Example of Typical Results Characteristics of the thermal resistances and heat capacities: Both curves should be smooth, with no steps, spikes or inflection points. Thermal resistances should always have negative slope that gradually decreases. Heat capacities should always have positive slope that gradually decreases. This cell is very well balanced. It is acceptable and usual to have larger differences between sample and reference.
Indium with Q Series Heat Flow Signals Q1000 Q100 Q10
Keeping the DSC Cell Clean • One of the first steps to ensuring good data is to keep the DSC cell clean • How do DSC cells get dirty? • Decomposing samples during DSC runs • Samples spilling out of the pan • Transfer from bottom of pan to sensor
How do we keep DSC cells clean? • DO NOT DECOMPOSE SAMPLES IN THE DSC CELL!!! • Run TGA to determine the decomposition temperature • Stay below that temperature! • Make sure bottom of pans stay clean • Use lids • Use hermetic pans if necessary
Cleaning Cell • If the cell gets dirty • Clean w/ brush • Brush gently both sensors and cell if necessary • Be careful with the Tzero™ thermocouple • Blow out any remaining particles
It Does Matter What Pan you use Monohydrate Pharmaceutical sample
Sample Shape • Keep sample thin • Cover as much as the bottom of pan as possible
Sample Shape • Cut sample to make thin, don’t crush • If pellet, cut cross section
Sample Shape • Cut sample to make thin, don’t crush • If pellet, cut cross section • If powder, spread evenly over the bottom of the pan
Using Sample Press • When using crimped pans, don’t over crimp • Bottom of pan should remain flat after crimping • When using Hermetic pans, a little more pressure is needed • Hermetic pans are sealed by forming a cold wield on the Aluminum pans Hermetic Pans Crimped Pans Not Sealed Good Bad Sealed
Sample Size • Larger samples will increase sensitivity but……………. • Larger samples will decrease resolution • Goal is to have heat flow of 0.1-10mW going through a transition
Sample Size • Sample size depends on what you are measuring • If running an extremely reactive sample (like an explosive) run very small samples (<1mg) • Pure organic materials, pharmaceuticals (1-5mg) • Polymers - ~10mg • Composites – 15-20mg
Purge Gas • Purge gas should always be used during DSC experiments • Provides dry, inert atmosphere • Ensures even heating • Helps sweep away any off gases that might be released • Nitrogen • Most common • Increases Sensitivity • Typical flow rate of 50ml/min
Purge Gas • Helium • Must be used with LNCS • High Thermo-conductivity • Increases Resolution • Upper temp limited to 350°C • Typical flow rate of 25ml/min • Air or Oxygen • Used to view oxidative effects • Typical flow rate of 50ml/min
Sample Temperature Range • Rule of Thumb • Have 2-3 minutes of baseline before and after transitions of interest - if possible • DO NOT DECOMPOSE SAMPLES IN DSC CELL • Temperature range can affect choice of pans • Just because the instrument has a temperature range of –90°C to 550°C (with RCS) doesn’t mean you need to heat every sample to 550°!
Heating Rate • Faster heating rates increase sensitivity but……………. • Faster heating rates decrease resolution • Good starting point is 10°C/min
Effect of Heating Rate PMMA 10.04mg
Thermal History • The thermal history of a sample can and will affect the results • The cooling rate that the sample undergoes can affect : • Crystallinity of semi-crystalline materials • Enthalpic recovery at the glass transition • Run Heat-Cool Heat experiments to see effect of & eliminate thermal history • Heat at 10°C/min • Cool at 10°C/min • Heat at 10°C/min