Business Operations Strategy Model Powerpoint Presentation Slides
770 likes | 798 Vues
Want to analyze weekly organization performance review? Finding difficulty in making agenda for more efficient and effective operations? Here we are to help you with our business operations strategy model PowerPoint presentation slides. Download here: https://www.slideteam.net/business-operations-strategy-model-powerpoint-presentation-slides.html

Business Operations Strategy Model Powerpoint Presentation Slides
E N D
Presentation Transcript
Business Operations Strategy Model Your Company Name
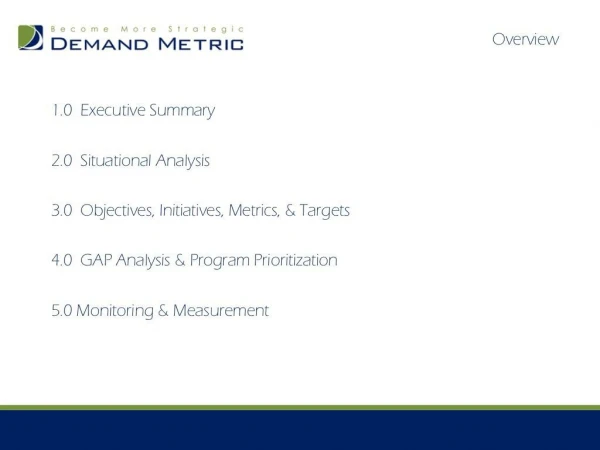
Table of Contents Title Title Slide No. Slide No. XX XX Business Operations Summary Potential Sources of Revenue XX XX Operational Highlights Sales & Marketing Challenges XX Milestones Achieved XX Risk Associated With Sales & Marketing XX Company Strategy XX Company Objectives XX Product Roadmap XX Operational Challenges XX Changes in Competitive Roadmap XX Partnering & Alliance Challenges XX Key Performance Indicators XX Checklist for Effective Business Partnerships XX Financial Summary: Base vs Stretch Plan XX Risk Associated With Strategic Alliances XX Organizational / Operational Setup Challenges XX New Customer Acquisition Cost XX Operational Setup-Risk & Mitigation XX Customer Lifetime Value XX Customer Service Related Challenges XX Calculating Customer Lifetime Value (CLV) Business Risk Associated With Customer Service XX XX Operating Plan XX Risk Mitigation Strategies For Customer Service XX Hiring Plan XX XX Current Sources of Revenue Risk Mitigation Strategies 2
Our Agenda 01 03 05 02 04 Agenda Agenda Agenda This slide is 100% editable. Adapt it to your needs and capture your audience's attention. This slide is 100% editable. Adapt it to your needs and capture your audience's attention. This slide is 100% editable. Adapt it to your needs and capture your audience's attention. Agenda Agenda This slide is 100% editable. Adapt it to your needs and capture your audience's attention. This slide is 100% editable. Adapt it to your needs and capture your audience's attention. 3
Business Operations Summary Some general business operations parameters to determine performance have been added in this slide which can be altered based on your requirement 73% Labor Utilization Rate-Ratio of billable hours to actual working hours 60 Total Customer Complaint 88% Customer Retention Rate 7/10 Customer Satisfaction Score 10% Rework Rate on the Job 29% Net Operating Margin 12 Average Number Of Orders Per Customer 78% Productivity 4
Operational Highlights- FY 18 Q4 FY18 Highlight 4 Q3 FY18 This slide is 100% editable. Adapt it to your needs and capture your audience's attention. Highlight 3 Q2 FY18 This slide is 100% editable. Adapt it to your Q1 FY18 needs and capture your audience's attention. Highlight 2 This slide is 100% editable. Adapt it to your needs and capture your audience's attention. Highlight 1 This slide is 100% editable. Adapt it to your needs and capture your audience's attention. 5
Milestones Achieved (Option 1of 2) 2013 This slide is 100% editable. Adapt it to your needs and capture your audience's attention. attention. 2015 This slide is 100% editable. Adapt it to your needs and capture your audience's 2017 This slide is 100% editable. Adapt it to your needs and capture your audience's attention. 2014 This slide is 100% editable. Adapt it to your needs and capture your audience's attention. 2016 This slide is 100% editable. Adapt it to your needs and capture your audience's attention. 6
Milestones Achieved (Option 2of 2) This slide is 100% editable. May FY14 This slide is 100% editable. Jun FY15 This slide is 100% editable. Jul FY16 This slide is 100% editable. Aug FY17 7
Company Objectives These are some of the common objectives which are discussed during the review meetings and can be altered as per user requirements Closing X number of sales by (date) Retain the current customer base Decrease Increase market share by x% operational expenses Increasing revenue/customer by x% 8
Operational Challenges Entering the market: sales / marketing / PR Challenges have been divided in to two parts: 1. Customer facing 2. back office challenges which are further classified in to 5 sub-categories Customer care / CRM Customer Facing Organizational / operations setup Challenges Optimize revenue sources Back Office Partners & alliances 9
Partnering & Alliances – Execution Stages Key things to be kept in mind while making this slide – • Main outcomes desired from the negotiation? • What is our company’s position? Partner company’s position? • Key points for each issue? • Cost benefit analysis of this partnership Partner Strategy Execution Identify gaps Investigate Negotiate Contract Manage Exit Comments Comments Comments Comments Comments Comments This slide is 100% editable. Adapt it to your needs and capture your audience's attention. This slide is 100% editable. Adapt it to your needs and capture your audience's attention. This slide is 100% editable. Adapt it to your needs and capture your audience's attention. This slide is 100% editable. Adapt it to your needs and capture your audience's attention. This slide is 100% editable. Adapt it to your needs and capture your audience's attention. This slide is 100% editable. Adapt it to your needs and capture your audience's attention. 10
Checklist Effective Business Partnerships Voluntary Nature The partners have clear and common goals based on mutual benefits Complementary Support Focus on your firm’s resources on what you do best and tap to the resources of others for rest Synergy The value added by this partnership should be greater than sum of individual contributions Shared Core Competency Develop a mechanism to leverage different types of competencies, resources, & capabilities Effective Communication Communication at all levels should be regular, open and transparent for effective decision making & solving business problems Common Interest Directing resources & capabilities to projects you consider as most important Mutual Dependency It arises by sharing risk, responsibilities, resources, competencies & benefits Respect & Trust It is one of the most effective mechanism for governing innovative business partnerships 11
Input Supply When Strategic partner is unwilling to supply raw material in a timely manner to meet the firm’s regular demand Surge Capacity When Strategic partner is unwilling to supply raw material in a timely manner to meet unusually high, unexpected demand Business Risk Associated With customer service Quality Performance When Strategic partner is unwilling to supply raw material according to firm’s quality standards Cost Renegotiation When Strategic partner will take advantage of its position at a later date and seek unexpected increase in the cost of raw materials Coordination When there is fundamental misunderstanding of each other requirements due to complexity associated with the task Financial Viability When Strategic partner experiences financial distress that limits its ability to meet your firms requirement Contribution Valuation When your firms non-monetary contribution to the partnership will be undervalued by the partner Financial Commitment When entering in to the partnership may expose the firm to credit risk 12
Organizational/Operational Setup Challenges This example has been taken for a manufacturing industry where the production needs to be increased + = 30% 40% Increase the labor XX% Increase the machinery Which will eventually result in production capacity increase in production workforce 13
Operational Setup-Risk & Mitigation Risk and Risk Mitigation Strategies for a manufacturing company has been taken as an example in this slide Risk Risk Mitigation Company might invest in Fixed Assets & increase the production capacity but later they might face deficit in the in-hand orders & the investment might turn out to be bad one ✓ A proper due-diligence needs to be conducted since investment in fixed assets is a part of long term strategy. ✓ Company first needs to have proper allocation & optimization of resources in place, after which consideration should be given to hire more employees ✓ Without proper planning & organizing restructuring, hiring more workforce will increase the fixed cost of the company ✓ 14
Customer Service Related Challenges Computer/ Telephone User Interface (CTI) Cash Flow Work Flow Call Sales & Marketing Strategies Less Employee Resources Handling Scripts Comments Comments Comments Comments Comments Comments This slide is 100% This slide is 100% This slide is 100% This slide is 100% This slide is 100% This slide is 100% editable. Adapt it to editable. Adapt it to editable. Adapt it to editable. Adapt it to editable. Adapt it to editable. Adapt it to your needs and your needs and your needs and your needs and your needs and your needs and capture your capture your capture your capture your capture your capture your audience's attention. audience's attention. audience's attention. audience's attention. audience's attention. audience's attention. 15
Business Risk Associated With Customer Service ✓ Inefficient routing protocols send voice calls and emails to useless contact details where they are never retrieved or responded to ✓ Lack of true integration of SCM and CRM systems ✓ Lack of visibility of the order status along the whole supply chain ✓ Inadequate staffing provides for an overloaded workforce where responses to inquiries may be unacceptably delayed or never answered at all ✓ Inability to respond to market demands caused by lack of integration among order-entry systems or due to infrastructure ✓ Web pages are static (not constantly updated), thus they do not respond to customer needs and demands ✓ New methods to improve customer service & reduce related costs are not utilized 16
Risk Mitigation Strategies For Customer Service Some general challenges have been considered which are faced in day-to-day operations during customer related service Recognize an Unhappy Customer Keep Customers in the Loop Empower Employees to Make Nice Gestures You can follow up with every customer or, at the very least, a random sampling of customers & ask them if all is well Make sure customers understand the steps you’re taking to fix a situation. Update customers often, even if the status remains unchanged Throwing in a little extra every now & then is a strong builder of good will. You might waive a late fee or throw in a free month of service. There need not necessarily be a complaint first Use Customer Feedback to Your Advantage Grease the Squeaky Wheels Take Action Empower employees to take steps necessary to make problems right. Have a clear line of communication they can follow when they need help from a manager Seek out customer feedback through surveys and via online searches. Respond to complaints made online so others can see that you care about the problems The loudest complainers are probably complaining loudly to others, as well. These customers need a little extra care to show them that you hear them & care about their problems 17
Current Sources of Revenue Other grants FY 17 Local sales FY 16 Others FY 15 Retained income FY 14 Revenue support grant FY 13 FY 12 Council tax 0 10 20 30 40 50 60 70 18
Coffee Break Let’s Start again in 30 Minutes 19
Potential Sources of Revenue Government (Fees & Grants) 10% 10% Social Security 45% 10% Others Private Sources (Contributions & Grants) 25% Private Sources (Fees & Services) 20
Some common challenges faced during sales and marketing Sales & Marketing Challenges Salespeople Reporting False or Misleading Information to Sales Management Sales Reps Short on Sales Skills No Reliable Automatic Way to Track Sales Salespeople Not Reporting Crucial Information Risk of Duplication Theft , Pilferage and Damage may take place during transportation and storage 21
Risk Associated With Sales & Marketing Information Risk Ethical Risk Executing the right strategy The most corrosive business in the wrong way calamity to shareholder value Sales & Marketing Strategic Risk With the explosion of data, quality Tactical Risk cannot keep pace, and uncontrolled Choosing the wrong data will lead to a major backfire business strategy 22
This slide is 100% editable. Adapt it to your needs and capture your audience's attention. Company Strategy This slide is 100% editable. Adapt it to your needs and capture your audience's attention. This slide is 100% editable. Adapt it to your needs and capture your audience's attention. 23
Product Roadmap: Product Launch Deliverables-1 75% 45% 25% 60% 90% Product launch deliverables 04 Product launch deliverables 02 Product launch deliverables 03 Product launch deliverables 01 Product launch deliverables 05 2017 2013 2014 2015 2016 24
Product Roadmap: Product Launch Deliverables-2 2014 Start End 2016 2017 2015 Phase 1 Phase 2 Phase 3 Phase 4 This slide is 100% editable. This slide is 100% editable. This slide is 100% editable. This slide is 100% editable. Adapt it to your needs and Adapt it to your needs and Adapt it to your needs and Adapt it to your needs and capture your audience's capture your audience's capture your audience's capture your audience's attention. attention. attention. attention. 25
Product Roadmap : Product Launch Deliverables Product Family 2014 2015 2016 2017 Product 01 Product 02 Product 03 Q1 Q2 Q3 Q4 Q1 Q2 Q3 Q4 Q1 Q2 Q3 Q4 Q1 Q2 Q3 Q4 26
Product Roadmap This slide is 100% editable. Adapt it to your needs and capture your audience's attention. This slide is 100% editable. Adapt it to your needs and capture your audience's attention. This slide is 100% editable. Adapt it to your needs and capture your audience's attention. 27
Changes In Competitive Environment Weekly Brand 1 This slide is 100% editable. Adapt 7 it to your needs and capture your audience's attention. Brand 2 Monthly 5 This slide is 100% editable. Adapt it to your needs and capture your Brand 3 audience's attention. 8 Brand 4 9 0 2 4 6 Engagement 8 10 12 14 16 18 28
Changes In Competitive Environment Brand 1 Brand 2 Brand 3 Brand 4 Competitive Landscape Competitive 1 Competitive 2 Competitive 3 Competitive 4 Competitive 5 Competitive 6 29
Key Performance Indicators Template-1 of 2 Day sales outstanding This slide is 100% editable. Adapt it to your needs and capture your audience's attention. Cost of goods sold This slide is 100% editable. Adapt it to your needs and capture your audience's attention. Net promoter score This slide is 100% editable. Adapt it to your needs and capture your audience's attention. Customer retention rate This slide is 100% editable. Adapt it to your needs and capture your audience's attention. % Sales lost to active customers This slide is 100% editable. Adapt it to your needs and capture your audience's attention. 30
Key Performance Indicators Template-2 of 2 10% 30% 70% 90% Area of focus # 1 Area of focus # 2 Area of focus # 3 Area of focus # 4 01 02 03 04 01 02 03 04 01 02 03 04 01 02 03 04 Objective Objective Objective Objective Measures Measures Measures Measures Targets Targets Targets Targets Invites Invites Invites Invites 31
Financials Summary: Base Plan VS Stretch Plan Financial Summary Base Plan Stretch Plan Comments KPI1 KPI2 KPI3 Revenue Cost of sales Gross profit Customer acquisition cost Other operating cost expense Operating profit Change in cash Ending cash Employees(FTES) 32
Financials: Base Plan Financial Summary Q1 17 Q2 17 Q3 17 Q4 17 KPI1 KPI2 KPI3 Revenue Cost of sales Gross profit Customer acquisition cost Other operating cost expense Operating profit Change in cash Ending cash Employees(FTES) 33
Financials: Stretch Plan Financial Summary Q1 17 Q2 17 Q3 17 Q4 17 KPI1 KPI2 KPI3 Revenue Cost of sales Gross profit Customer acquisition cost Other operating cost expense Operating profit Change in cash Ending cash Employees(FTES) 34
New Customer Acquisition Cost $2.00 x100 $2,000 Visitors This slide is 100% editable. Adapt it to your needs and capture your audience’s attention. Leads This slide is 100% editable. Adapt it to your needs and capture your audience’s attention. Customers This slide is 100% editable. Adapt it to your needs and capture your audience’s attention. x20 x8 COST PER CUSTOMER IS $250.00 35
Customer Lifetime Value (CLV) Inactive Nonprofit Able Customer 20% Active Profitable Customers 60% Very Active Very Profitable Customers 20% 10 Number of customers 8 LOW CLV MEDIUM CLV HIGH CLV 6 4 2 0 Lifetime Value = (Average Order Value) X (Number Of Repeat Sales) X (Average Retention Time) 36
Calculating Customer Lifetime Value (CLV) Complete CLV Year 0 1 2 3 4 Average acquisition cost 500 500 1,000 1,500 2,000 Average customer revenue - 300 600 900 1,200 Average customer costs - 290 ??? 255 ??? Average customer profit - 100% 60% 65% 70% Customer retention rate - ??? 365 32% ??? Cumulative retention rate - ??? 785 ??? 1,211 Likely customer profit - 1.10 ??? ??? ??? Discount rate - ??? 457 784 546 CLV – per year 1 ??? 325 152 451 Cumulative CLV ??? 500 1,000 1,500 2,000 37
Operating Plan Priority Actions #1: Priority Actions #2: Priority Actions #3: Priority Actions What System Support/ Resources? - Text Here Text Here Who Responsible? - - Text Here When Done? - Text Here Text Here How To Measure? - - Text Here Annual Status - Text Here Text Here 38
300 250 Engineering 70 45 200 Sales 40 50 60 45 150 45 Marketing 36 45 35 35 30 100 40 Product 25 40 45 40 20 30 Support 50 35 30 25 20 25 20 30 30 Finance 25 20 10 Q1 0 Q1 Q2 Q3 Q4 2017 2018 Hiring Plan This slide is 100% editable. Adapt it to your needs and capture your audience’s attention. 39
Team Goals (Template 1 of 2) Employees JAN /30 FEB/15 MAR/10 MAY/25 Objectives Jack Hill Designation Objective 01 Rose Albert Designation Objective 02 Anita Smith Objective 03 Designation Miller Bails Objective 04 Designation John Finder Objective 05 Designation 40
Team Goals (Template 2 of 2) Team Q1 17 Q2 17 Q3 17 Q4 17 - Engineering Text Text Text - Product Text Text Text - - - Marketing Text - - - Sales Text - - - Support Text - Finance/Admin Text Text Text 41
Risk Mitigation Strategies This slide is 100% editable. This slide is 100% editable. Risk This slide is 100% editable. This slide is 100% editable. Strategies This slide is 100% editable. This slide is 100% editable. This slide is 100% editable. This slide is 100% editable. 42
Additional Slides
Our Mission & Vision Mission This slide is 100% editable. Adapt it to your needs and capture your audience's attention. Vision This slide is 100% editable. Adapt it to your needs and capture your audience's attention. 45
About Us Target Audiences 01 This slide is 100% editable. Adapt it to your needs and capture your audience's attention. Preferred by Many 02 This slide is 100% editable. Adapt it to your needs and capture your audience's attention. Values Client 03 This slide is 100% editable. Adapt it to your needs and capture your audience's attention. 46
Meet Our Team John Hill Julie Parker This slide is 100% editable. Adapt This slide is 100% editable. Adapt it to your needs and capture your it to your needs and capture your audience's attention. audience's attention. CEO & Founder Finance Manager Lee Hester Miller Bails This slide is 100% editable. Adapt This slide is 100% editable. Adapt it to your needs and capture your it to your needs and capture your audience's attention. audience's attention. Designer Accountant 47
Our Main Goal Goal 01 Goal 02 Goal 03 Goal 04 This slide is 100% editable. Adapt it to your needs and capture your audience’s attention. 48
Comparison This slide is 100% editable. Adapt it to your needs and capture your audience’s attention. This slide is 100% editable. Adapt it to your needs and capture your audience’s attention. This slide is 100% editable. Adapt it to your needs and capture your audience’s attention. 2015 30% 70% 2016 40% 60% 2017 60% 40% 60% 40% Female Male 49
Our Target This slide is 100% editable. This slide is 100% editable. Adapt it to your needs and Adapt it to your needs and capture your audience’s capture your audience’s attention. attention. This slide is 100% editable. This slide is 100% editable. Adapt it to your needs and Adapt it to your needs and capture your audience’s capture your audience’s attention. attention. 50