Download
1 / 10
100 likes | 176 Vues
A validated specific stability indicating reversed-phase liquid chromatographic method was developed for the<br>quantitative determination of Aripiprazole and its related substances in bulk samples, pharmaceutical dosage forms<br>in presence of degradation products. Forced degradation studies were performed on bulk sample of Aripiprazole as<br>per ICH prescribed stress conditions using acid, base, oxidative, thermal stress and photolytic degradation to show<br>the stability indicating power of the method. Significant degradation was observed during basic stress and no<br>degradation was observed in other stress conditions. The chromatographic method was optimized using the samples<br>generated from forced degradation studies and the impurity spiked with Aripiprazole. Good resolution between the<br>peaks corresponds to impuritiy-1, degradation products from the analyte were achieved on YMC PACK C18 column<br>using the mobile phase consists a mixture of Sodium dihydrogen Orthophosphate dehydrate with1-Hexane sulfonic<br>acid sodium pH adjusted to 3.0 with ortho-phosphoric acid in water and Acetonitrile using a simple linear gradient.<br>The detection was carried out at 215 nm.The stressed test solutions were assayed against the qualified working<br>standard of Aripiprazole and the mass balance in each case was in between to 98.9-100.1% indicating that the<br>developed LC method was stability-indicating. Validation of the developed LC method was carried out as per ICH<br>requirements. The developed method was found to be suitable to check the quality of bulk samples of Aripiprazole at<br>the time of batch release and also during its storage (Long term and accelerated stability).

E N D
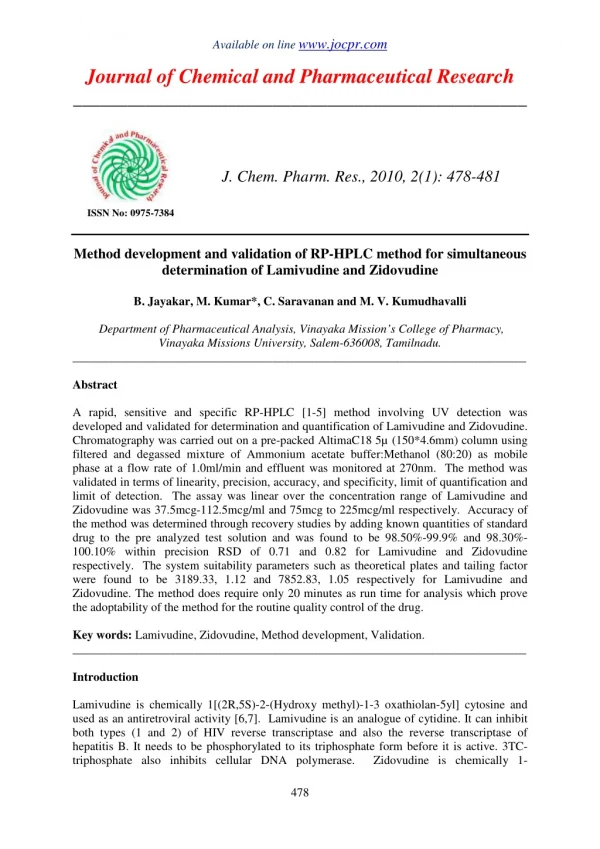
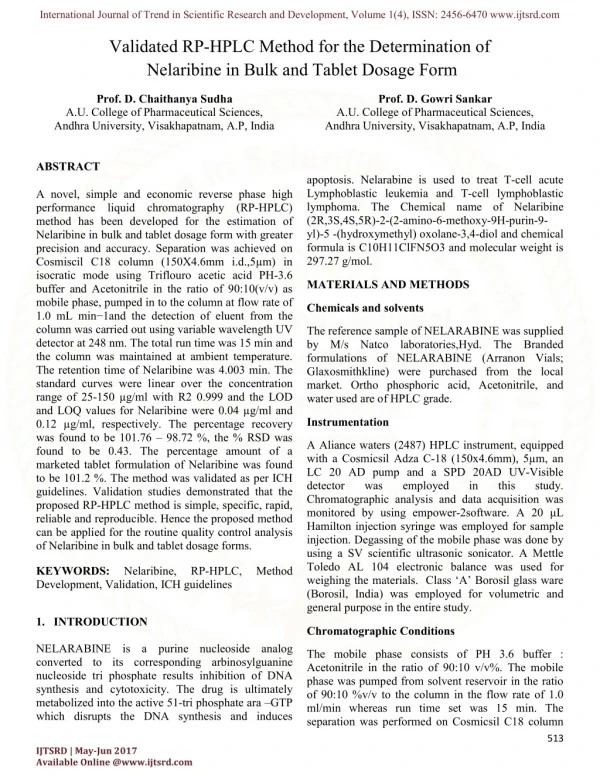
Available online www.jocpr.com Journal of Chemical and Pharmaceutical Research, 2012, 4(9):4426-4435 ISSN : 0975-7384 CODEN(USA) : JCPRC5 Research Article A Validated specific Stability-indicating RP-HPLC method for Aripiprazole and its related substances Narayana M B V1 and K. B. Chandrasekhar2 1Matrix Laboratories Private Limited, Hyderabad 500 078, India 2Department of Chemistry, Jawaharlal Nehru Technological University Anantapur, Anantapur 515002, India __________________________________________________________________________________________ ABSTRACT A validated specific stability indicating reversed-phase liquid chromatographic method was developed for the quantitative determination of Aripiprazole and its related substances in bulk samples, pharmaceutical dosage forms in presence of degradation products. Forced degradation studies were performed on bulk sample of Aripiprazole as per ICH prescribed stress conditions using acid, base, oxidative, thermal stress and photolytic degradation to show the stability indicating power of the method. Significant degradation was observed during basic stress and no degradation was observed in other stress conditions. The chromatographic method was optimized using the samples generated from forced degradation studies and the impurity spiked with Aripiprazole. Good resolution between the peaks corresponds to impuritiy-1, degradation products from the analyte were achieved on YMC PACK C18 column using the mobile phase consists a mixture of Sodium dihydrogen Orthophosphate dehydrate with1-Hexane sulfonic acid sodium pH adjusted to 3.0 with ortho-phosphoric acid in water and Acetonitrile using a simple linear gradient. The detection was carried out at 215 nm.The stressed test solutions were assayed against the qualified working standard of Aripiprazole and the mass balance in each case was in between to 98.9-100.1% indicating that the developed LC method was stability-indicating. Validation of the developed LC method was carried out as per ICH requirements. The developed method was found to be suitable to check the quality of bulk samples of Aripiprazole at the time of batch release and also during its storage (Long term and accelerated stability). Keywords: Liquid chromatography, Forced degradation, RSD and validation, Aripiprazole _____________________________________________________________________________________________ INTRODUCTION Aripiprazole is described chemically as 7-[4-[4-(2,3-dichlorophenyl)piperazin-1-yl]butoxy]-3,4-dihydro-1H- quinolin-2-one Aripiprazole is a novel atypical antipsychotic drug for thetreatment of schizophrenia and schizoaffective disorders [1,2]. The drug is metabolized by the cytochrome P450 isoenzymes 3A4and 2D6. Because of high inter individual variability inthe expression of these enzymes; the aripiprazole concentrationvaries among healthy individuals after administration of thedrug [3]. A HPLC method for quantitaion of Aripiprazole in human plasma [4] and an LC-MS/MS method for the quantitative determination of aripiprazole and its main metabolite [5] have been reported. Also determination of aripiprazole HPLC with Column-Switching and Spectrophotmetric Detection [6, 7] was available in the literature. As per cGMP practice and ICH-Q1A (R2) guidelines stress studies on drug should be carried out to establish inherent stability and to identify the degradation products hence to show the stability indicating of the proposed analytical procedures. So far, based on literature survey, there was no stability indicating HPLC methods for Aripiprazole in bulk sample have been developed. Hence the present research work was to carry stress studies recommended by ICH and to develop a suitable stability indicating LC method for the determination of Aripiprazole .The developed method was validated with respect to specificity, LOD, LOQ, linearity, precision, accuracy and 4426
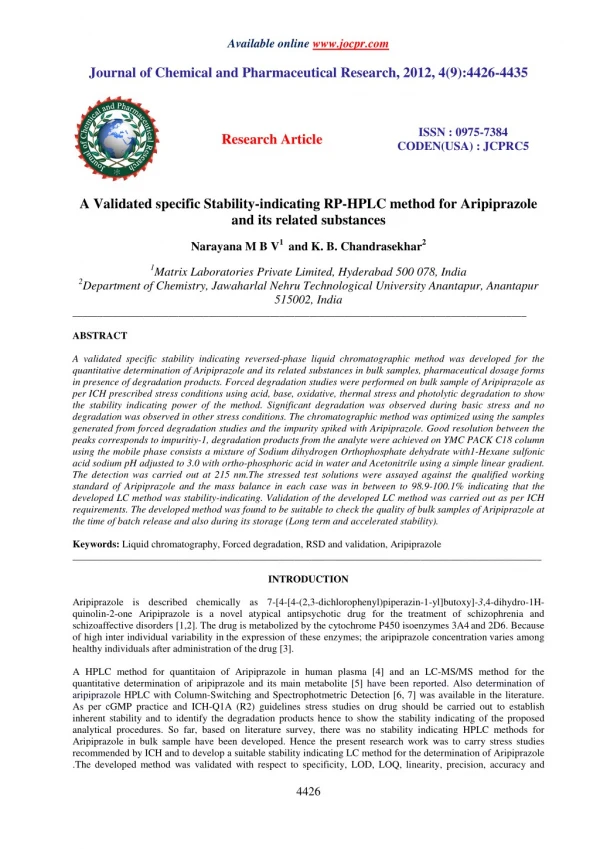
Narayana M B V et al ______________________________________________________________________________ J. Chem. Pharm. Res., 2012, 4(9):4426-4435 robustness to show the stability indicating power of the method and also to ensure the compliance in accordance with ICH Guidelines [8]. EXPERIMENTAL SECTION Chemicals and reagents Aripiprazole drug substance (Fig. 1) and impurity-1 were received from Bulk Actives, Unit-II of Dr. Reddy’s Laboratories, Hyderabad, India. HPLC grade Acetonitrile was purchased from Rankem, Mumbai, India. Ortho-phosphoric acid was purchased from Qualigens Fine Chemicals, Mumbai, India. Sodium dihydrogen phosphate dihydrate was purchased from Qualigens Fine Chemicals, Mumbai, India. 1-Hexane sulfonic acid sodium was purchased from Loba Chemie Mumbai, India. High pure water was prepared by using Millipore Milli Q plus purification system. Aripiprazole 7-[4-[4-(2,3-dichlorophenyl)piperazin-1-yl]butoxy]-3,4-dihydro-1H-quinolin-2-one (Mol. Wt.: 448.38) Impurity-1 O H N N N Cl O 7-[4-[4-(3-chlorophenyl)piperazin-1-yl]butoxy]-3,4-dihydro-1H-quinolin-2-one (Mol. Wt.: 413.94) Fig.1 Chemical structure of Aripiprazole and impurity. Equipment The LC method development, validation and forced degradation studies were done using Agilent 1200 series HPLC system with photo diode array detector. The data were collected and the peak purity of the Aripiprazole peak was checked using chemstation software. The photolytic degradation was carried out using Binder KBS215 photolytic chamber. Chromatographic Conditions The chromatographic separations were achieved on YMC PACK C18 column 150 mm length X 4.6 mm ID with 5 µm particle size using the solvent A as 25 mM Sodium dihydrogen Orthophosphate dihydrate with 1-Hexane sulfonic acid sodium salt pH adjusted to 3.0 with ortho phosphoric acid in water and solvent B as Acetonitrile with a gradient programme: Time (min)/% solvent B, 0/25, 12/40, 17/80, 30/80 with a post run time of 5 minutes. The column temperature was maintained at 40°C and the detection was carried out at 215 nm. The test concentration was about 300 µg mL-1 and the injection volume was 20 µL. A degassed mixture of solvent A and acetonitrile in the ratio of 50:50 v/v was used as diluent during the standard and test samples preparations. Preparation of standard and sample Solutions Standard and sample solutions were prepared in diluent at about 300 µg mL-1 for the determination of assay and related substances analysis. A stock solution of impurity-1 at 200 µg mL-1 was also prepared in diluent. 4427
Narayana M B V et al ______________________________________________________________________________ J. Chem. Pharm. Res., 2012, 4(9):4426-4435 Method Validation Stress Studies/Specificity Stress testing of the drug substance can help to identify the likely degradation products, which can in turn help to establish the degradation pathways and the intrinsic stability of the molecule. Specificity is the ability of the method to measure the analyte response in the presence of its potential impurities [9]. All stress degradation studies were performed at an initial drug concentration of 300 µg mL-1. Acid stress was performed in 0.5 N HCl at 60°C for 5 days. The study in basic solution was carried out in 0.1 N NaOH at ambient temperature for 24 hours. Oxidation studies were carried out at ambient temperature in 3.0 % hydrogen peroxide for 3 days. Photo degradation studies were carried out according to Option 2 of Q1B in ICH guidelines [10].The drug sample was exposed to light for and overall illumination of 1.2 million lux hours and an integrated near ultraviolet energy of 200 W h m2 . The drug sample was exposed to dry heat at 80 °C for 5 days. Samples were withdrawn at appropriate times and subjected to LC analysis after suitable dilution (300 µg mL-1) to evaluate the ability of the proposed method to separate Aripiprazole from its degradation products. Photodiode array detector was employed to check and to ensure the homogeneity and purity of Aripiprazole peak in all the stressed sample solutions. Assessment of mass balance in the degraded samples was carried out to confirm the amount of impurities detected in stressed samples matches with the amount present before the stress was applied. Quantitative determination of Aripiprazole was carried out in all the stressed samples against qualified working standard and the mass balance (% assay + % sum of all impurities + % sum of all degradation products) was tabulated inTable1. Limit of Detection (LOD) and Limit of Quantification (LOQ) The LOD and LOQ for Aripiprazole and its impurity was estimated at a signal-to-noise ratio of 3:1 and 10:1, respectively, [11, 12] by injecting a series of diluted solutions with known concentration. Precision study was also carried at the LOQ level by injecting six individual preparations of Aripiprazole spiked impurity at LOQ level and calculating the RSD percentage of the area. Linearity The linearity of an analytical procedure is its ability (within a given range) to obtain test results, which are directly proportional to the concentration of the analyte in the sample [13]. Linearity test solutions for the assay method were prepared from 50 to 150% of with respect to analyte concentration 300 µg mL-1 (i.e. 150, 225, 300, 375 and 450 µg mL-1) respectively. The peak area versus concentration data was performed by least-squares linear regression analysis. Linearity test solutions for related substance method were prepared by diluting the impurity stock solution to the required concentrations. The solutions were prepared at six concentration levels from LOQ to 200% with respect to the impurity specification level of 0.10% (i.e. LOQ, 0.05, 0.075, 0.10, 0.125, 0.15 and 0.2%). The calibration curve was drawn by plotting the peak areas of impurity-1 versus its corresponding concentration. Linearity test was performed for two consecutive days in the same concentration range for both assay and related substance method. The correlation coefficient of the calibration curve was calculated. Precision Assay method precision was evaluated by carrying out six independent assays of test sample of Aripiprazole against qualified working standard and calculated the percentage of RSD. The precision of the related substance method was checked by injecting six individual preparations of Aripiprazole spiked with 0.10% level of impurity-1 with respect to target analyte concentration (i.e. 300 µgmL-1). RSD percentage of area for impurity-1 was calculated. The intermediate precision of the method was also verified using different analyst, different day and different make instrument in the same laboratory. The intermediate precision of the method was also verified using different analyst, different day and different make instrument in the same laboratory. Accuracy The accuracy of an analytical procedure expresses the closeness of agreement between the value, which is accepted either as a conventional true value or an accepted reference value and the value found [14]. The accuracy of the assay method was evaluated in triplicate at three concentration levels i.e. 150, 300 and 450 µg mL-1 in bulk drug samples. The percentage recoveries were calculated from the slope and Y-intercept of the calibration curve. Standard addition and recovery experiments were conducted to determine accuracy of the related substance method for the quantification of two impurities in bulk drug samples. The study was carried out in triplicate by spiking each impurity at 0.05, 0.10 and 0.15% in bulk drug sample solution (300 µg mL-1). The percentage recoveries for impurity-1 calculated from the slope and Y-intercept of the calibration curve 4428
Narayana M B V et al ______________________________________________________________________________ J. Chem. Pharm. Res., 2012, 4(9):4426-4435 Selectivity The selectivity of the method was established from the resolution of the drug peak from the nearest peak and also among all the other peaks. All the degradation products and impurity were separated amongst as well as from analyte with a resolution greater than 6.6 show the selectivity of the method. Solution stability and mobile Phase Stability The solution stability of Aripiprazole was carried out by leaving the test solution and the test solution spiking with the impurities at 0.10% level with respect to anlayte concentration in a tightly capped volumetric flask at room temperature for 48 h. The solution was assayed at 6 h intervals to the end of the study period, using a freshly prepared standard solution of Aripiprazole for comparison each time. The mobile phase stability was also investigated by assaying the freshly prepared sample solutions against freshly prepared standard solutions at 6 h intervals up to 24 h and after at intervals of 24 h up to 5 days. Mobile phase composition and preparation was kept constant during the study period. The % RSD of the assay of Aripiprazole and impurities was calculated during the duration of the mobile phase and solution stability experiments. Robustness To evaluate the robustness of the developed LC method, the chromatographic conditions were deliberately altered, System suitability parameters like tailing factor, theoretical plates and the resolution between impurity-1 and with the analyte peak was evaluated. To study the effect of flow rate on the resolution, the flow rate was altered by 0.2 units i.e. 0.6 and 1.0 mL min-1 from the actual flow 0.8 mL min-1. The effect of column temperature on resolution was studied at 35°C and 45°C instead of 40°C. The effect of change in the mobile phase composition by changing the % of Acetonitrile in gradient by 2%. All the other mobile phase components were held constant as described above. The effect of pH was studied by changing pH by 0.5 units from the actual value 3.0 keeping remaining method conditions were kept constant. RESULTS AND DISCUSSION Optimization of Chromatographic Conditions The main target of the chromatographic method is to develop a suitable stability indicating method for Aripiprazole and its impurities in presence of degradation products. Aripiprazole UV absorbance is too low for quantitation above 215 nm, so the mobile phase composition restricted to organic solvent such as Acetonitrile/Methanol and phosphate as buffer. 10 mM Sodium dihydrogen ortho phosaphate buffer with pH 3.0 was selected as aqueous mobile phase and Acetonitile as organic mobile phase. At these conditionsit was found that the retention of Aripiprazole was very less on different columns like C8, C18 Cyno, XTerra and Phenyl stationary phases .As the compound is more polar, taken YMC pack AQ.C18 column at pH 3.0 the peak shape was good compared to other columns although retention is very less, to increase the retention in the phosphate buffer mobile phase, ion pairing agent 1-Hexane sulfonic acid sodium salt was introduced and pH was adjusted to 3.0 with phosphoric acid. At these mobile phase conditions stressed solutions and impurity spiked solutions were injected with a gradient programme :Time (min)/% solvent B, 0/25, 15/60, 25/80, 30/80.The degradation product formed at 0.22 RRT in basic stress was not well separated from main the impurity, to separate the degradation product from the impurity the solvent B was slowly increased as a gradient programme: Time (min)/% solvent B, 0/25, 12/50, 17/80, 30/80 with a post run time of 5 minutes at these conditions the degradation product well separated from the impurity and ananlyte although retention is less . Still to increase the retention, to get better resolution the buffer concentration was increased to 25 mM and flow rate was decreased to 0.8 mL min-1 with some change in gradient programme as Time (min)/% solvent B, 0/25, 12/40, 17/80, 30/80 with a post run time of 5 minutes. At these chromatographic conditions all the degradation products and impurity were well separated amongst and also from Aripiprazole.The effect of buffer pH was also studied under the above conditions and it was found that at higher and lower pH the tailing of the Aripiprazole peak was more and also resolution was poor between impurity, degradants and analyte.The results clearly indicated that on YMC PACK AQ C18 column 150 mm length X 4.6 mm ID with 5 µm particle size and solvent A as 1-Hexane sulfonic acid sodium in Sodium dihydrogen Orthophosphate dihydrate with pH 3.0 by phosphoric acid, solvent B as acetonitrile with a gradient programme: Time (min)/% solvent B, 0/25, 12/40, 17/80, 30/80 with a post run time of 5 minutes at detection wavelength 215 nm was successful in separation of drug from its impurity and degradation products. Under the above conditions, results were as follows, retention time of Aripiprazole was around 8.5 min, with a tailing factor of 1.1, number of theoretical plates (N) for the Aripiprazole peak was 54237 and % RSD for 5 replicate injections was 0.3% and impurity-1 was eluted at retention time 5.4 minutes of with a resolution 7.8(Fig.2). Peak purity of stressed samples of Aripiprazole was checked by using a photodiode array detector of Agilent 1200 series, the purity factor is with in the threshold limit in all the stress samples, demonstrating the homogeneity of analyte peak (Fig.3). Accelerated and long term stability study results as per ICH Q1A (R2) for Aripiprazole were generated for 6 months by using the developed LC method and the results were well within the limits this further confirms the stability indicating of the developed LC method. 4429
Narayana M B V et al ______________________________________________________________________________ J. Chem. Pharm. Res., 2012, 4(9):4426-4435 Table 1. Results of stress studies Mass balance (% assay +% sum of all impurities +% sum of all degradants) Percentage assay of Aripiprazole Stress condition Period of study Remarks Acid hydrolysis (0.5 N HCl at 60°C) 5 days 98.6 99.3 No degradation products formed Two Unknown major degradation products were formed Base hydrolysis (0.1 N NaOH at RT °C) 24 h 82.5 98.9 Oxidation (3.0 % H2O2 at ambient temperature) Water hydrolysis at 80°C Thermal degradation at 80 °C Photolytic degradation 3 days 98.3 99.5 No degradation products formed 5 days 5 days 11 days 98.5 98.9 99.6 100.1 99.3 99.7 No degradation products formed No degradation products formed No degradation products formed Table 2. Results of stability samples (Long term and Accelerated conditions) of Aripiprazole (B.No: ARP00E08) Long term condition Water Content by KF Off-White color powder 1 st month color powder 2 nd month color powder 3 rd month color powder 6 th month color powder 9 th month color powder 12 th month color powder Accelerated condition Off-White color powder 1 st month color powder 2 nd month color powder 3 rd month color powder 6 th month color powder Related substances by HPLC Any Assay on Anhydrous basis Total impurities Storage condition Period Description Unknown impurity Impurity-1 Initial 0.4 0.03 0.02 0.09 99.7 Off-White 0.6 0.04 0.02 0.08 99.4 Off-White 0.4 0.03 0.03 0.08 99.5 Temperature 25°C±2°C, Relative humidity 60±5% Off-White 0.3 0.05 0.02 0.09 99.2 Off-White 0.5 0.04 0.03 0.10 99.3 Off-White 0.6 0.03 0.02 0.08 99.6 Off-White 0.5 0.04 0.03 0.10 99.5 Initial 0.4 0.03 0.02 0.07 99.7 Off-White 0.3 0.04 0.03 0.10 99.4 Temperature 40°C±2°C, Relative humidity 75±5% Off-White 0.5 0.05 0.01 0.08 99.6 Off-White 0.6 0.04 0.03 0.11 99.2 Off-White 0.4 0.05 0.02 0.09 99.3 Table 3. Results of Assay and Related Substances for Aripiprazole of three production batches Water Content by KF Impurity-1 Off-White color powder Off-White color powder Off-White color powder Related substances by HPLC Any Unknown impurity Total impurities Assay on Anhydrous basis Btach No: Description ARP00K13 0.5 0.05 0.03 0.09 99.4 ARP00Z04 0.4 0.06 0.02 0.12 99.6 ARP00A09 0.6 0.04 0.03 0.10 99.3 System suitability A system suitability test of the chromatography system was performed before each validation run. Five replicate injections of a system suitability/calibration standard and one injection of a check standard were made. Impurity spiked solution was also injected for checking resolution. Area relative standard deviation, tailing factor, and efficiency for the five suitability injections were determined. The check standard was quantified against the average of the five suitability injections. For all sample analyses, the tailing factor was ≤2.0; theoretical plates ≥55628, %R.S.D ≤2.0% and 100.0±2.0% check standard recovery. The resolution between impurity-1 and analyte was showing ≥ 7.2 4430
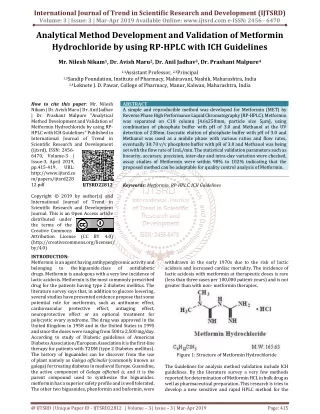
Narayana M B V et al ______________________________________________________________________________ J. Chem. Pharm. Res., 2012, 4(9):4426-4435 a) b) Fig. 2 Typical HPLC chromatogram of Blank, Aripiprazole spiked with known impurities Results of Forced Degradation Aripiprazole was stable under stress conditions such as photolytic stress, acid, oxidative hydrolysis and thermal conditions. While significant degradation of the drug substance was observed under basic stress leads to the formation of two major unknown degradation peaks at 0.22 RRT (Degradant-1) and at 2.41 RRT (Degradant-2) along with some small degradation products (Fig 2 c). Peak purity test results obtained from PDA confirm that the Aripiprazole peak is homogeneous and pure in all the stress samples analyzed. The mass balance is a process of adding together the assay value and the levels of impurities and degradation products to see how closely these add up to 100% of initial value with due consideration of the margin of analytical error [15]. The mass balance of stressed samples was close to 100% (Table 1). The assay of Aripiprazole was unaffected by the presence of degradation products thus confirms the stability-indicating power of the developed method. Results of Method Validation Limit of Detection (LOD) and Limit of Quantification (LOQ) The LOD and LOQ of impurity-1 is 0.07 µg mL-1and 0.21 µg mL-1 respectively (of analyte concentration. 300 µg mL-1). Linearity Linear calibration plot for the assay method was obtained over the calibration ranges tested, i.e. 50 to 150% of assay analyte concentration and the correlation coefficient obtained was greater than 0.9991. Linearity was checked for the assay method over the same concentration range for two consecutive days. The results show that an excellent correlation existed between the peak area and concentration of the analyte.Linear calibration plot for the related substance method was obtained over the calibration ranges tested, i.e. LOQ to 0.20% for impurity-1. The correlation coefficient obtained was greater than 0.996. Linearity was checked for the related substance method over the same concentration range for two consecutive days. The results demonstrate that an excellent correlation existed between the peak area and concentration of impurity-1. 4431
Narayana M B V et al ______________________________________________________________________________ J. Chem. Pharm. Res., 2012, 4(9):4426-4435 c) d) 4432
Narayana M B V et al ______________________________________________________________________________ J. Chem. Pharm. Res., 2012, 4(9):4426-4435 e) f) 4433
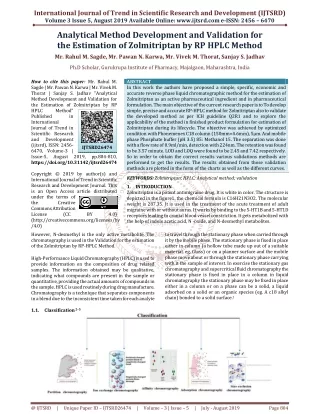
Narayana M B V et al ______________________________________________________________________________ J. Chem. Pharm. Res., 2012, 4(9):4426-4435 g) Fig.3 Typical peak purity HPLC chromatograms of Aripiprazole under various stress conditions (basic, acidic, oxidative, photolytic,Thermal) respectively during forced degradation study. Precision The RSD percentage of assay of Aripiprazole during assay method precision study was well within 1.0% and the RSD percentage of area of impurity-1 in related substance method precision study was within 3.3%. The RSD percentage of assay results obtained in the intermediate precision study was within 1.0% and the RSD percentage of area of impurity-1 were within 5.3%, confirming the good precision of the developed LC method. The method precision for impurity-1 at LOQ level was below 4.9% RSD. Accuracy The percentage recovery of Aripiprazole in bulk drug samples ranged from 99.1 to 100.4. The percentage recovery of impurity-1 in bulk drugs samples ranged from 95.8 to 99.4. Robustness In all the deliberate varied chromatographic conditions (flow rate, column temperature, pH variation) the resolution between Aripiprazole and impurity as well as degradation products was not significantly affected hence the developed LC method was robust for the determination of Aripiprazole in bulk samples. Application of the developed LC method to Stability samples and Quality monitoring of Aripiprazole Accelerated and Long term stability studies are carried out to establish retest period or a shelf life of drug product, to know the effect of storage conditions at different atmospheric conditions and to show the stability indicating of the method [16]. Aripiprazole samples stored at Long term condition (Temperature: 25°C±2°C, Relative humidity 60±5%) Accelerated (Temperature:40°C±2°C,Relative humidity 75±5%) were analyzed by using the developed LC method for period of one year at different intervals i.e; Initial, 1,2 , 3, 6, 9, and 12 months (Table 2).And also by using the developed LC method quality of the Aripiprazole was monitored during production of three batches (Table 3).The Results clearly indicates that the drug was stable under Long term and Accelerated conditions and there were no interference of the impurities for Aripiprazole which demonstrates that developed LC method was stability indicating and well applied for drug stability study as well as to quality monitoring of Aripiprazole. CONCLUSION In this paper a specific, validated and well-defined single Stability-indicating LC method for the quantitative determination of Aripiprazole as well as its related substances was described and the behavior of Aripiprazole under various stress conditions was studied and presented. All the degradation products formed during stress conditions 4434
Narayana M B V et al ______________________________________________________________________________ J. Chem. Pharm. Res., 2012, 4(9):4426-4435 and process impurities were well separated from the drug substance indicates the developed LC method was a simple accurate, specific and stability indicating. The information presented here in could be very useful for quality monitoring of bulk samples and as well employed to check the quality of drug during stability studies. Acknowledgments The authors wish to thank the colleagues and research scholars for supporting this work. We would also like to thank colleagues in separation science division of Chemie laboratories-India Private Limited for their cooperation in carrying out this work. REFERENCES [1]Jordan S, Koprivica V, Dunn R, Tottori K, Kikuchi T, Altar CA. Eur J Pharmacol, 2004, 483, 45-53. [2]Shapiro DA, Renock S, Arrington E, Chiodo LA, Liu LX, Sibley DR, et al. Neuropsychopharmacology2003, 28, 1400-1411. [3]Mallikaarjun S, Salazar DE, Bramer SL. J Clin Pharmacol, 2004, 44, 179-187. [4]Lancelin F, Djebrani K, Tabaouti K, Kraoul L, Brovedani S, Paubel P, Piketty ML. J Chromatogr B Analyt Technol Biomed Life Sci,2008, May 867(1), 15-9. [5]Kubo M, Mizooku Y, Hirao Y, Osumi T;J Chromatogr B Analyt Technol Biomed Life Sci,2005 Aug 5, 822(1- 2), 294-9. [6]Kirschbaum KM, Müller MJ, Zernig G, Saria A, Mobascher A, Malevani J, Hiemke C. Clin Chem. 2005, Sep, 51(9, 1718-21. [7]Wei Jiang, journal of bioluminescence and chemiluminescence, DOI: 10.1002/bio.1008 [8]ICH, Text on validation of analytical procedures, Q2A (R1). International Conference on Harmonization, IFPMA, Geneva. [9]Guidance for Industry: Analytical Procedures and Methods Validation: Chemistry, Manufacturing, and Controls Documentation. Draft Guidance. US Food and Drug Administration [10]ICH (1996) Photo stability Testing of New Drug Substances and Products Q1B, International Conference on Harmonization, IFPMA, Geneva [11]Ghulam A. Shabir, Journal of Chromatography A, Volume 987, Issues 1-2, 14 February 2003, Pages 57-66. [12]Ribani, M.; Bottoli, C. B. G.; Collins, C. H.; Jardim, I. S. F.; Melo, L. F. C.; Quim. Nova2004, 27, 771. [13]Validation of Compendial Methods, The United States Pharmacopeia, (2000) 24th edn, USP 24, Section <1225> [14]Validation of Chromatographic methods; Reviewer guidance, Centre for Drug Evaluation and research (CDER).November 1994, CMC 3. [15]Bakshi M, Singh S (2002) J Pharm Biomed Anal, 28, 1011–1040 [16]International Conference on Harmonization (ICH) guideline, Stability Testing of New Drug Substances and Poducts Q1A (R2), 1996. IFPMA, Geneva. 4435