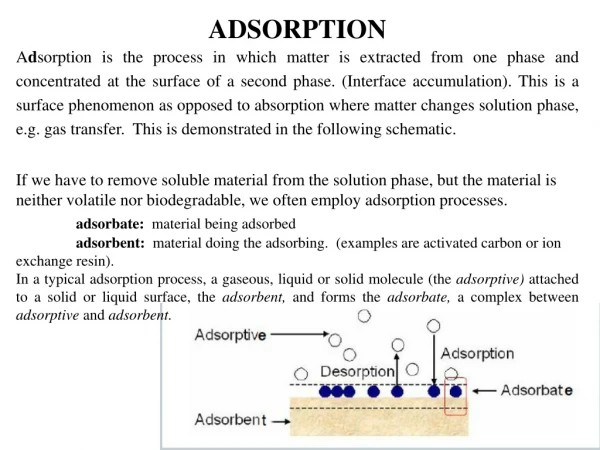
Download
1 / 9
100 likes | 175 Vues
The present study was carried out to evaluate the feasibility of fish scale for the separation of<br>annatto pigment from inert materials. Batch experiments were performed to study the<br>adsorption of the pigment on fish scale adsorbent. The maximum adsorption capacity of the<br>adsorbent for the dye was 12 mg L−1. Three simplified kinetic models viz. pseudo-first-order,<br>pseudo-second-order, and Weber and Morris intra-particle diffusion models were tested to<br>describe the adsorption process. Kinetic parameters, rate constants, equilibrium sorption<br>capacities, and related correlation coefficients for kinetic models were determined. It was<br>found that the present system could be described more favorably by the pseudo-second-order<br>kinetic model. The results of the present study suggest that fish scale can be used beneficially for separation of annatto pigment from inert materials. <br>

E N D
Available on line www.jocpr.com Journal of Chemical and Pharmaceutical Research J. Chem. Pharm. Res., 2010, 2(5): 75-83 ISSN No: 0975-7384 CODEN(USA): JCPRC5 Adsorption of pigment from annatto seed utilizing Fish Scale as biosorbent M M Bora North East Institute of Science and Technology, Jorhat, Assam, India (Council of Scientific & Industrial Research) ___________________________________________________________________________ ABSTRACT The present study was carried out to evaluate the feasibility of fish scale for the separation of annatto pigment from inert materials. Batch experiments were performed to study the adsorption of the pigment on fish scale adsorbent. The maximum adsorption capacity of the adsorbent for the dye was 12 mg L−1. Three simplified kinetic models viz. pseudo-first-order, pseudo-second-order, and Weber and Morris intra-particle diffusion models were tested to describe the adsorption process. Kinetic parameters, rate constants, equilibrium sorption capacities, and related correlation coefficients for kinetic models were determined. It was found that the present system could be described more favorably by the pseudo-second-order kinetic model. The results of the present study suggest that fish scale can be used beneficially for separation of annatto pigment from inert materials. Keywords : Bixa orellana, bixin, fish scale, adsorption, equilibrium, kinetic model. ___________________________________________________________________________ INTRODUCTION Bixa Orellana known as the annatto plant, is small evergreen tree (5-10 meter in height) native in the N E India. Inside a prickly reddish-orange, heart shaped pods at the ends of the branches; the seed are found. These seeds are the source of coloured material (Figure 1). Two β-carotinoids namely bixin (Figure 2) and nor-bixin are the major constituents of the coloured pigment along with some other materials like sucrose, essential oil, fixed oil and proteins. The pigments are widely utilized in food and have their application in cheese, butter, ice- cream, meat etc. and other applications include medicines and cosmetics [1]. For efficient utilization of the dye, separation of the coloured pigment from other materials is necessary. In this study, the pigment from Bixa orellana seeds was separated from other materials by adsorption with adsorbent prepared from fish scale. This process is cheap and environment friendly. Understanding of basic phenomenon of adsorption equilibrium and kinetics is necessary to enhance the adsorption affinity to reduce non-specific adsorption. The main objective of this work is to study the equilibrium and kinetics of adsorption of the pigment on 75
M M Bora J. Chem. Pharm. Res., 2010, 2(5): 75-83 ___________________________________________________________________________ to fish scale biosorbent. The desorbed product was characterized by FTIR, UV-VIS, 1H NMR spectroscopy and thin layer chromatography. Figure 1 Fruit and seed of Bixa (Annatto) CH3 CH3 O O CH3 OH O CH3 CH3 Figure 2 Structure of bixin EXPERIMENTAL SECTION 2.1 Materials Bixa Orellana seeds were collected from Jorhat, Assam in N E region, India. Alcohol, n- butanol, methyl ethyl ketone and Ammonium hydroxide were procured from E. Merck, Germany. The waste fish scale were collected from the local market. The adsorbent was developed using these wastes by the method reported elsewhere [2] . These were first washed with distilled water and dried in an oven at 80 °C for 24 h. The dried fish scale were ground and this material was then thermally activated (carbonized) at 800 ± 50 °C in a muffle furnace for 1 h in the absence presence of air. After activation, the ash content was removed by washing it with distilled water and dried in an oven at 100 ± 5 °C for 24 h. The particle size of BSS 200 mesh sizes was used in the present study. 2.2. Extraction of yellow-red pigment Bixa Orellana matured air-dried seeds (500 g) were heated at 700C with distilled water in a 1000 ml beaker to obtain the crude coloured matter. This process was repeated until the water becomes colourless to ensure complete extraction of coloured matter. Total extract was concentrated under reduced pressure over a water bath to get a concentrated mass of colour component. Yield of crude material is 104 g. Concentrated mass (70 g) was dissolved in distilled water (250 ml) and adsorbed with fish scale adsorbent (75 g) with constant stirring until aqueous solution was found to be colourless. The adsorbent was then separated from colourless aqueous phase and washed with distilled water and air-dried. Desorption of pigment was carried out with 100 ml of alcohol with constant stirring for 2 h. Colour extract was collected, fresh solvent mixture added and same procedure was repeated until colour in the extract was negligible. Colour product was concentrated for removal of solvent under reduced pressure over a water bath to get an yellowish-red coloured mass. The yield was found to be 27.2 g. The collected mass was characterized by FTIR spectroscopy 76
M M Bora J. Chem. Pharm. Res., 2010, 2(5): 75-83 ___________________________________________________________________________ (Perkin Elmer system 2000, Model 640B), UV-VIS spectroscopy (Shimadzu, Model 160 A) and 1H NMR spectroscopy (Bruker, 300 MHz FT NMR spectrometer) and thin layer chromatography. 2.3. Batch Equilibrium and Kinetic Studies To understand the behaviour of adsorption equilibrium, solution of the pigment obtained from above process (50 ml; initial conc., 10 mg L-1) was taken in stoppered conical flasks. Adsorbent (0.1-0.3 g L-1) of desired particle size was added in each solution. Solutions were equilibrated in an isothermal shaker at 25 °C. Dye concentration in aqueous solutions was measured in a UV spectrophotometer calibrated with standard bixin at 453 nm. Experiments were carried out in duplicate and accuracy was within ± 10%. For kinetic study, in a set of five numbers of Erlenmeyer flasks (100 ml), the pigment solution (50 ml; initial conc., 10 mg L-1) and adsorbent (0.1-0.3 g L-1) were added and kept in an isothermal shaker at 300 K. Aqueous sample concentrations were determined at different time interval by UV-Spectrophotometer calibrated at 453 nm. RESULTS AND DISCUSSION 3.1. Effect of contact time In order to establish the equilibration time for maximum uptake and to know the kinetics of the adsorption process, dye adsorption on fish scale adsorbent was investigated as a function of contact time and the results are shown in Fig. 3. The figure shows that the uptake rate gradually increases with 95% of the adsorption was complete within 2 h. Equilibrium was achieved within 2 h (Fig. 3), therefore, an equilibration period of 2 h was selected for all further experiments. The time profile of pigment uptake is a single, smooth, and continuous curve leading to saturation, suggesting the possible monolayer coverage of pigment on the surface of the adsorbent [2]. 100 0.1 g C 0.2 g C 0.5 g C 90 Percentage of pigment adsorption 80 70 60 50 40 30 20 10 20 40 60 80 100 120 140 160 Figure 3 Effect of contact time on adsorption of annatto pigment on fish scale Adsorbent Time (Minute) Table 1 Parameters obtained from pseudo second order kinetic model C0 (mgL-1) qe(exp) (mg g−1) K2 (g mg−1 min−1) qe(cal) (mg g−1) R2 10 30.9 1.066×10⁻³ 38.31 0.997 77
M M Bora J. Chem. Pharm. Res., 2010, 2(5): 75-83 ___________________________________________________________________________ 3.2. Kinetic modeling Three simplified kinetic models namely pseudo-first-order, pseudo-second-order and Weber and Morris intra-particle diffusion models have been discussed to identify the rate and kinetics of sorption of dye on fish scale adsorbent [2, 3]. 3.2.1. Pseudo-first-order model The Lagergren's rate equation is one of the most widely used rate equations to describe the adsorption of an adsorbate from the liquid phase. The linear form of pseudo-first-order equation is given as [log (qe - qt) = log qe - (kad t/2.303)] (1) where ‘qe’ and ‘qt’ (mg g−1) are the amount of pigment adsorbed at equilibrium and at time t, respectively, and kad is the pseudo-first-order rate constant. A plot of log (qe-qt) vs t gives linearized form of pseudo- first-order kinetic model of pigment adsorption on the adsorbent (not shown here). The slopes and intercept of log (qe–qt) versus t plot were used to determine the first-order rate constants (kad) and qe(cal), along with correlation coefficient (R2) values. It is seen that the theoretical qe(cal) values calculated from the pseudo-first-order model did not give reasonable values with regard to the experimental uptake ones, qe(exp). Further, the correlation coefficient (R2 = 0.89) value also suggests that that the present adsorption system does not follow pseudo-first-order process. 3.2.2. Pseudo-second-order model The kinetics was also described as pseudo-second-order process [2] t /qt = 1/ k2 qe2 +(1/qe)t (2) Where ‘qe’ and ‘qt’ are the amount of dye adsorbed (mg g−1) at equilibrium and at time t, respectively, and k2 is the rate constant of pseudo-second-order kinetics. The plots between t/qt and t were drawn and are shown in Fig. 4. As can be seen from Table 1 that the theoretical qe(cal) values agree well with the experimental uptake values, qe(exp) in case of pseudo-second-order model. Further, the correlation coefficient (R2) for the pseudo-second- order kinetic model was 0.997 suggesting that the present adsorption system can be described more favorably by pseudo-second-order process. 5 4 t/q [min (mg g-1)-1] 3 2 1 0 0 50 100 150 200 t (min) Figure 4 Pseudo-second-order kinetic model plots of annatto pigment on fish scale adsorbent 3.2.3. Weber and Morris intra-particle diffusion model Kinetic data was further analyzed using the intra-particle diffusion model based on the theory proposed by Weber and Morris [2,4]. The amount of pigment adsorbed (qt) at time (t) was plotted against the square root of time (t1/2), according to Eq. (3) and the resulting plot is shown in Fig. 78
M M Bora J. Chem. Pharm. Res., 2010, 2(5): 75-83 ___________________________________________________________________________ qt=kidt1/2+C (3) where kid is the intra-particle diffusion rate constant and C is the intercept related to the thickness of the boundary layer. According to Eq.(3), a plot of qt versus t1/2 should be a straight line from the origin if the adsorption mechanism follows the intra-particle diffusion process only. However, if the data exhibit multi-linear plots, then the process is governed by two or more steps. Figure (5) shows that the plot is a straight line which confirm the adsorption mechanism follow intra-particle diffusion process only. However, the intercept of the line fails to pass through the origin which may be due to the difference in the rate of mass transfer in the initial and final stages of adsorption [4]. Further, such deviation of the straight lines from the origin reveals that the pore diffusion is not the sole rate-controlling step [2]. 40 35 30 qt (mg g-1) 25 20 15 10 5 0 5 7 9 11 13 t1/2 (min)-1/2 Figure 5 Weber and Morris intra-particle diffusion model of annatto pigment on fish scale adsorbent 3.3. Adsorption models The adsorption equilibrium data were analyzed into two well known isotherm models viz. Langmuir and Freundlich models. 3.3.1. Langmuir model The adsorption isotherm was also fitted to Langmuir model [5-8]. The Langmuir equation which is valid for monolayer adsorption onto a surface is given below [Eq. (4)]: Ce /qe = 1/ KL+ (bL / KL) Ce (4) where qe (mg g−1) is the amount adsorbed at the equilibrium concentration Ce (mol L−1), KL (mg g−1) is the Langmuir constant representing the maximum monolayer adsorption capacity and bL (L mol−1) is the Langmuir constant related to energy of adsorption. The plots of Ce/qe as a function of Ce for the adsorption of dye were found linear (Fig 6A), suggesting the applicability of Langmuir model in the present adsorption system. The correlation coefficients (R2 = 0.993) confirm good agreement between both theoretical models and our experimental results. The values of the monolayer capacity (KL) and equilibrium constant (bL) have been evaluated from the intercept and slope of these plots and given in Table 2. It is seen from Table 2 that monolayer capacity (KL) of the adsorbent for the pigment is comparable to the maximum adsorption obtained from the adsorption isotherms. These facts suggest that the pigment is adsorbed in the form of monolayer coverage on the surface of the prepared adsorbent. 79
M M Bora J. Chem. Pharm. Res., 2010, 2(5): 75-83 ___________________________________________________________________________ 12 0.3 g C 0.2 g C 0.1 g C 0.1 g C 0.2 g C 0.1 g C 2.0 10 1.5 -1 8 Ce/ qe x100 g L log qe 6 1.0 4 0.5 2 0.0 0 0 1 2 3 4 5 6 7 8 9 10 11 -1.0 -0.5 0.0 0.5 1.0 -1 log Ce Cemg L (b) (a) Figure 6 Adsorption of Annatto pigment onto fish scale adsorbent at 300 K (a) Langmuir adsorption; and (b) Freundlich adsorption Table 2: Constants obtained from Langmuir and Freundlich isotherm model Langmuir Freundlich Absorbent weight (g) KL (mg g-1) b (L mol-1) R2 KF n R2 0.1 0.684 0.83 1 49.65 0.14 0.837 0.2 1.45 2.07 1 49.16 0.24 0.983 0.3 2.01 1.459 1 84.92 0.21 0.946 3.3.2. Freundlich model The Freundlich model which is an indicative of surface heterogeneity of the adsorbent is described by the following equation [9] qe = KF.Cen log qe = log KF + n log Ce (5) where KF and n are Freundlich constant, associated with adsorption capacity and heterogeneity factor respectively. The Freundlich plots between log qe and log Ce for the adsorption of pigment are shown in figure (6b). Values of heterogeneity factor (n<1) indicates Freundlich isotherm as favourable isotherm [9]. However, values of correlation coefficient R2 suggest better fit of Langmuir isotherm model than Freundlich model. 3.4. Desorption The adsorbent (0.3 g) was loaded by maximum adsorption of pigment (12 mg L-1) (Fig.7a). Desorption was carried out after optimization with hot water at different contact time (Fig. 7b). Yellow-red pigment was recovered at (97.4 %) from loaded fish scale. 3.5. Analysis of the desorbed dye 3.5.1. IR analysis The IR spectra of bixin (Fig. 8) show peaks at 3432 cm-1 (O-H stretching of –COOH group), 2971 cm-1 (C-H stretching of alkenes), 2919 cm-1, 2850 cm-1 (C-H stretching of alkanes). Presence of –COOH group is indicated by the peaks at 1713 cm-1, 1274 cm-1 (C-O stretching) and 1432 cm-1 (O-H bending). Peaks at 1631 cm-1 and 1518 cm-1 appear due to C=C 80
M M Bora J. Chem. Pharm. Res., 2010, 2(5): 75-83 ___________________________________________________________________________ stretching of conjugated diene. CH3 asymmetric and CH3 symmetric bending of alkane groups show peaks at 1458 cm-1 and 1380 cm-1 respectively. 140 0.3 g C 0.2 g C 0.1 g C 12 120 Desorption of pigment (mg L-1) 10 100 qe ( mg g-1) 8 80 6 60 4 40 2 20 20 40 60 80 100 120 140 160 10 12 14 16 18 20 22 24 26 Time (Minute) Dye concentration mg L -1 (b) (a) Figure 7 Plot of (a) Amount of pigment adsorbed per unit mass at equilibrium (qe) with concentration of pigment at different adsorbent concentration at 300K (b) Amount of desorption of pigment from adsorbent with time Presence of methyl ester group in the bixin structure results the peaks at 1350 cm-1 (symmetric stretching of CH3 group), 1200 cm-1 [CC(=O)-O stretching] and 1160 cm-1 (O- C=C asymmetric stretching). The in plane and out of plane C-H bending vibration of alkene groups show peaks at 1016 cm-1, 967 cm-1 and 853 cm-1 respectively [10]. 80 75 70 T% 65 60 55 4000 3500 3000 2500 2000 1500 1000 500 WAVENUMBER (cm-1) Figure 8 FTIR spectra of Annatto Extract after desorption from fish scale adsorbent 81
M M Bora J. Chem. Pharm. Res., 2010, 2(5): 75-83 ___________________________________________________________________________ 3.5.2. UV-VIS analysis The UV-VIS spectra of the sample show peaks at 423 nm, 453 nm and 485 nm which are in good agreement with that obtained for bixin by Haberli and Pfander [11]. These peaks are due to n→π* transitions of alkene, -COOH and –COOCH3 groups respectively. 3.5.3. 1H NMR analysis Peaks obtained in the 1H NMR spectra of the desorbed sample in DMSO solvent (Fig.8) was analysed (Table 3) and compared with those obtained by A. Haberli and H. Pfander [11]. These peaks clearly confirm the sample to be bixin. However, as some additional peaks are there in the spectra, so some other groups may also be present with along with bixin. Table 3 1H NMR analysis of Annatto pigment after desorption from Adsorbent (fish scale) 3.5.4. Thin layer chromatographic analysis A 10 µL of solution of the crude and fish scale desorbed annatto extract in 95 % ethanol was applied to a TLC (layer thickness: 250 µm, size: 5×20 cm). The plate was allowed to dry and developed with a mixture of n-butanol, methyl ethyl ketone and 10 % aqueous NH3 (3:2:2 by volume) until the solvent front has ascended about 10 cm. While several spots appeared in the crude sample, the desorbed sample gave two yellow-red spots with Rf values 0.51 and 0.43 respectively. This confirms the separation of the two carotinoids from other constituents. CONCLUSION The results of the present study reveal that fish scale can be beneficially utilized as an effective adsorbent for separation of annatto pigment from other inert materials. The adsorption capacity of the adsorbent for the pigment was found to be 12 mg L-1. 97.4 % of the adsorbed pigment was recovered by desorption with alcohol. Kinetic studies suggest that the adsorption can be described more favourably by pseudo second order kinetic model. Equilibrium studies show that Langmuir isotherm model better fit to this adsorption than Freundlich model. Acknowledgement The authors would like to thank MOEF New Delhi for its financial support, also Director of our institute, Head of Department of Chemical Engineering Division Dr N N Dutta and Project Fellow Miss Ponchami Sharma. Peak position 1.97 (s) 1.99 (s) 3.80 (s) 6.27 (d) 6.35 (d) 6.43 (d) 6.53 (d) 6.62 (dd) 6.68 (m) 6.84 (dd) 7.47 (d) 7.92 (d) Assignment Me(19,19') Me(20,20') MeO H-C(7,7') H-C(10', 14,14') H-C(12') H-C(10,12) H-C(11) H-C(15,15') H-C(11') H-C(8) H-C(8') 82
M M Bora J. Chem. Pharm. Res., 2010, 2(5): 75-83 ___________________________________________________________________________ REFERENCES [1]R. W Alves, A. A. U.de Souza, Ulson de Souza Guelli, S. M. de A rruda, P. Jauregi, Separation and Purification Technology (2006), 48, 208-213. [2]A. Bhatnagar, A. K. Minocha, M. Sillanpaa, Biochemical engineering journal (2010), 48, 181-186. [3]M. M. Bora, N. N. Dutta, P. G Rao,. J. Sci. Ind. Res. ,(2009), 68, 555-559. [4]V.Gómez, M. S. Larrechi, M. P. Callao, Chemosphere, (2007), 69, 1151-1158 [5]W. A. I Tan, H. B Hameed, A. L Ahmad, Chem Engg J., (2007),127, 111-119. [6]R. L. Tsen, S. K. Tseng, J Colloid. Interface Sci. , (2005), 287, 428-437. [7]G. Walker, A.Weatherley, Chem Engg J., (2001) 83, 201- 206. [8]V. Varavilhya, S. Phongkitkarum, S. Jatchavala, Z. L. Ngeontham, J Med Assoc Thai, (2005) , 88 (1), 35-41. [9]M. Dutta, R. Baruah, N. N. Dutta, A. C. Ghosh, Colloids and Surfaces A: Physicochemical and Engineering Aspects., (1997),127 , 25-37 [10]R. M. Silverstein, G. C. Bassler, G. C. Morrill, Spectrometric identification of organic Compounds, (1991), (5th ed.) John Wiley and Sons, Inc. [11]A. Haberli, , H. Pfander, Helvetica Chemica Acta., (1999), 82, 696-706. 83