Download
1 / 6
60 likes | 96 Vues
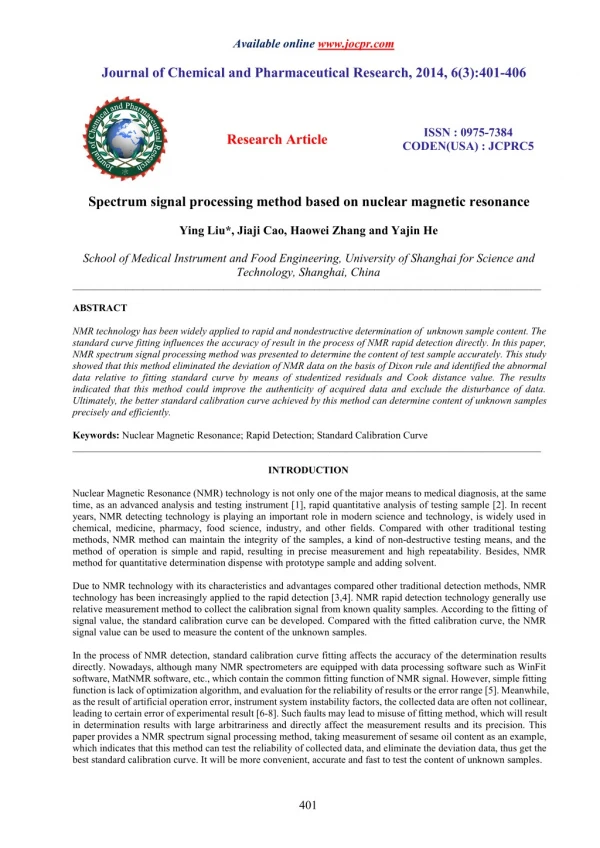
NMR technology has been widely applied to rapid and nondestructive determination of unknown sample content. The<br>standard curve fitting influences the accuracy of result in the process of NMR rapid detection directly. In this paper,<br>NMR spectrum signal processing method was presented to determine the content of test sample accurately. This study<br>showed that this method eliminated the deviation of NMR data on the basis of Dixon rule and identified the abnormal<br>data relative to fitting standard curve by means of studentized residuals and Cook distance value. The results<br>indicated that this method could improve the authenticity of acquired data and exclude the disturbance of data. Ultimately, the better standard calibration curve achieved by this method can determine content of unknown samples<br>precisely and efficiently.

E N D
Available online www.jocpr.com Journal of Chemical and Pharmaceutical Research, 2014, 6(3):401-406 ISSN : 0975-7384 CODEN(USA) : JCPRC5 Research Article Spectrum signal processing method based on nuclear magnetic resonance Ying Liu*, Jiaji Cao, Haowei Zhang and Yajin He School of Medical Instrument and Food Engineering, University of Shanghai for Science and Technology, Shanghai, China _____________________________________________________________________________________________ ABSTRACT NMR technology has been widely applied to rapid and nondestructive determination of unknown sample content. The standard curve fitting influences the accuracy of result in the process of NMR rapid detection directly. In this paper, NMR spectrum signal processing method was presented to determine the content of test sample accurately. This study showed that this method eliminated the deviation of NMR data on the basis of Dixon rule and identified the abnormal data relative to fitting standard curve by means of studentized residuals and Cook distance value. The results indicated that this method could improve the authenticity of acquired data and exclude the disturbance of data. Ultimately, the better standard calibration curve achieved by this method can determine content of unknown samples precisely and efficiently. Keywords: Nuclear Magnetic Resonance; Rapid Detection; Standard Calibration Curve _____________________________________________________________________________________________ INTRODUCTION Nuclear Magnetic Resonance (NMR) technology is not only one of the major means to medical diagnosis, at the same time, as an advanced analysis and testing instrument [1], rapid quantitative analysis of testing sample [2]. In recent years, NMR detecting technology is playing an important role in modern science and technology, is widely used in chemical, medicine, pharmacy, food science, industry, and other fields. Compared with other traditional testing methods, NMR method can maintain the integrity of the samples, a kind of non-destructive testing means, and the method of operation is simple and rapid, resulting in precise measurement and high repeatability. Besides, NMR method for quantitative determination dispense with prototype sample and adding solvent. Due to NMR technology with its characteristics and advantages compared other traditional detection methods, NMR technology has been increasingly applied to the rapid detection [3,4]. NMR rapid detection technology generally use relative measurement method to collect the calibration signal from known quality samples. According to the fitting of signal value, the standard calibration curve can be developed. Compared with the fitted calibration curve, the NMR signal value can be used to measure the content of the unknown samples. In the process of NMR detection, standard calibration curve fitting affects the accuracy of the determination results directly. Nowadays, although many NMR spectrometers are equipped with data processing software such as WinFit software, MatNMR software, etc., which contain the common fitting function of NMR signal. However, simple fitting function is lack ofoptimization algorithm, and evaluation for the reliability of results or the error range [5]. Meanwhile, as the result of artificial operation error, instrument system instability factors, the collected data are often not collinear, leading to certain error of experimental result [6-8]. Such faults may lead to misuse of fitting method, which will result in determination results with large arbitrariness and directly affect the measurement results and its precision. This paper provides a NMR spectrum signal processing method, taking measurement of sesame oil content as an example, which indicates that this method can test the reliability of collected data, and eliminate the deviation data, thus get the best standard calibration curve. It will be more convenient, accurate and fast to test the content of unknown samples. 401
Ying Liu et al ______________________________________________________________________________ J. Chem. Pharm. Res., 2014, 6(3):401-406 EXPERIMENTAL SECTION The principle of NMR standard calibration curve The method of standard calibration curve, is to test the NMR signal amplitude of known-content standard sample, the collected signal amplitude of different mass standard samples can be used to fit a standard calibration curve, that testing content of sample is linearly related to the signal amplitude. As a result, the testing content of unknown samples can be determined by the fitting linear equation [9]. Experimental platform Adopting nuclear magnetic resonance spectrometer (0.5 T) as experimental equipment, we take the example of determining sesame seed oil content. Pure sesame oil was selected as standard sample to calibrate. Ten samples different mass of pure sesame oil, weighted and injected into test tubes, marked as A-J respectively in ascending order of sample mass. FID signal value of test sample was set as dependent variables, and the mass of sesame oil as independent variable can be calculated according to the fitting line equation. Consequently, the sesame oil content of test sample can be determined. Preparation of sampling should be made as accurate as possible to avoid errors, because a small amount of pure oil will lead to obvious difference of NMR signal. Meanwhile the uniformity of magnetic field should be adjusted carefully. Otherwise under the condition of bad uniformity will affect the accuracy of FID signal amplitude. Experimental Data Processing Method and Procedure In order to check the error of collected data, eliminate the interference of abnormal data, and improve the accuracy of the measured data, we present data processing method, which is based on magnetic resonance spectrum signal. Firstly the model test gross error, and the abnormal data and influential point can be identified. Then, the re-collected date after eliminating the error, and significance test of regression equation is verified. Finally, fitting FID signal amplitude of each sample by least square method achieves better effect of standard calibration curve, and the content of unknown sample can be determined more accurately. NMR signal acquisition Main magnetic field strength of desktop NMR was 0.5 T, setting up relevant sampling parameters, among which the value of center frequency SF1=23 MHZ, offset O1=334.270 KHz, the rest of the parameters were default settings. After adjusting the center frequency, signal of sample were collected repeatedly. The measured FID signal by use of Fast Fourier Transform extracted its peak value. The FID signal value of all standard sample was repeatedly tested in order. Since the limitation of the desktop NMR instrument when detecting the sample (the altitude of sample in the test tube should be no less than 1 cm), there is few small value points in abscissa and the collected data was mainly focused on the fitting scope with great abscissa values. Deviation of the test data Finding out whether tested data was with deviation or not, the point was set at the origin of coordinates (0, 0), making 10 lines based on signal amplitude point A, B, C, D, E, F, G, H, I, J, as shown in Fig.1. The slope K of 10 points respectively were acquired as follow, KA=3.84, KB=4.07, KC=3.73, KD = 4.04, KE = 3.52, KF = 3.98, KG = 3.92, KH=4.01, KI = 4.01, KJ = 4.15. Since the sample capacity for rapid detection was small, it was not suitable to use Laiyite criterion to eliminate errors. We can use Dixon criterion for sample capacity 3≤n<30 to eliminate the deviation. Fig.1: The test of the data deviation Dixon rule is a method making use of the maximum and minimum sampling value, which can make the detection more simplified and stricter. The data sampling was listed in numerical order. The statistic value of high-end outliers and low-end outliers can be tested as following: 402
Ying Liu et al ______________________________________________________________________________ J. Chem. Pharm. Res., 2014, 6(3):401-406 When the sample capacity is 8 n 10 , as shown in Eq.1 x x ) 1 ( x x ) 1 ( n ) ( n ) 2 ( ' 11 r , r 11 x x ) 1 ( x x (1) ) 1 ( n ) ) 2 ( ( n ' r 11 r In this formula, outliers. So when n=10, is the testing statistic of the high-end outliers, and is the testing statistic of the low-end 11 x x . 4 15 . 4 07 . 0 08 ) 1 10 ( x ) 10 ( x x 11 r . 0 19 . 4 15 . 3 73 . 0 42 10 ( x ) ) 2 ( . 3 52 . 3 73 . 0 21 ) 1 ( ) 2 ( ' r . 0 38 11 ) 1 ( x x . 3 52 . 4 07 . 0 55 ) 1 10 ( 0( , ) r n According to the probability density function derived by Dixon, we can calculate the critical value under the condition of a given significance level α. x x x x x x ) 1 10 ( ) 10 ( 11 r 10 ( . 0 , 05 ) . 0 477 . 0 19 10 ( x ) ) 2 ( x ) 1 ( ) 2 ( ' r 10 ( . 0 , 05 ) . 0 477 . 0 38 11 ) 1 ( 10 ( ) 1 It was clear that if the statistics of inspecting high-end and low-end abnormal value calculated by formula was greater than the critical value, it was considered to be free of error for the measurement data. Eliminating abnormal and influential point Studentized residuals formula is shown in Eq.2, to identify whether each data point relative to the fitting standard calibration line is abnormal, and the identified abnormal points should not be eliminated immediately, but need to be further decided whether it will seriously impact on the result before we eliminate it, and measure the influence degree by Cook 's D Statistic method, Cook distance formula as follows on Eq.2. i r , i ,..., 1 n i 1 h ii x 2 ( x ) 1 i h ii n n i 2 ( x x ) i (2) 1 Among in Eq.2, the value of The Cook distance is shown as follows, 2 i ii h ir is students residual, i is residual, σ is standard deviation, n is sample size. h r D i 1 ( 2 ) (3) ii According to studentized residuals value and the Cook distance value calculated by studentized residuals and the Cook distance formula, as shown in Table 1. According to the critical value table of studentized residuals, we can get S 2.290 , studentized residuals value of point E value, which is obviously greater than other points, it means that point E is an abnormal point and have a great influence on result, which should be eliminated, as shown in Fig.2. ir 2.334 2.290 ,and Cook distance 0.3037 is the maximum 1- 0. 05(10) Table 1: Studentized residual and Cook distance of data Data point Y Studentized Residual Cook distance A B C D E F G H I J 270 304.89 290 323.11 300 350.43 352.54 372.67 385 415 0.2372 1.2428 -0.768 0.8437 -2.334 0.1875 -0.301 0.1474 0.0216 0.9984 0.0168 0.2343 0.0616 0.0563 0.3037 0.0021 0.0064 0.0022 0.0001 0.27 403
Ying Liu et al ______________________________________________________________________________ J. Chem. Pharm. Res., 2014, 6(3):401-406 Fig.2: The elimination of outlier and influential point Significance Testing After re-collecting data point Making use of least square fitting for collected data without error achieves the final standard calibration line, as shown in Fig.3. E 85,328 , the processing method test abnormal and influential point repeatedly. Fig.3: Fitting of standard calibration line Make further validation about the fitting quality by correlation coefficient test, F-test and residual standard deviation. The correlation coefficient test formula is as follows in Eq.4: n x x y y i i . 0 ( i 1 . 0 996 01 , N ) 2 . 0 735 x , y n n i i 2 2 x x y y i i (4) 1 1 calculated from the sample was bigger than the critical value 0.735, so the fitting equitation 2 1 i is regression sum of squares, residual sum of squares, which means that it is significant on 5% level. Since the , x y 2 n y n y 1 i Q y U y y 4.032x-5.161 i i i was highly significant. Among in, is 2 S U ) 2 2 F 1152.581 , 1 ( 05 . 0 F n . 5 12 ) 2 2 Q /( n S 1 (5) Residual standard deviation, formula is as shown in Eq.5, can be used to measure the value of the y average variation caused by random factors, so it can be the precision index of the prediction index of regression equation, if the residual standard deviation is smaller, the accuracy of the regression straight line will be higher. 404
Ying Liu et al ______________________________________________________________________________ J. Chem. Pharm. Res., 2014, 6(3):401-406 Q 2 s 10.274 n (6) RESULTS AND DISCUSSION Standard calibration equation of the straight line prior to data processing was: y = 4.005 x - 5.597, after using the above method, we can get the new standard calibration equation of the straight line as: y = 4.032x-5.161. Theoretically, FID signal should be proportional to the content of pure oil, while intercept exists in the linear equation. It may caused by the noise from the instrument and the nonlinear amplification in the circuit. If the obtained regression equation of the straight line is more close to the theoretical standard calibration curve, the test results of the sample content calculated according to the standard calibration curve will be more accurate. Table 2: Regression analysis of standard curve Correlation Coefficent 0.989 0.996 F-test 492.503 1152.581 Residual Standard Deviation 15.611 10.274 Original fitting line New fitting line The the two standard curve fitting are shown in Table 2. Original processing method is to use the least squares fitting directly to the ten signal amplitude points. Compared with the standard calibration line obtained by the original method, we can see that the new standard calibration curve correlation coefficient and significance increases, and the residual standard deviation decreases under the condition that the abnormal data of the collected data is eliminated and identified. By contrast, the new standard linear achieved by the data processing method based on NMR signal is better, and the regression precision is improved. It means that this method reduces the influence on the experimental results caused by the error data, which can improve the accuracy and repeatability of the rapid detection of NMR technology. And the content of unknown samples can be more quickly and accurately determined according to the standard calibration straight line achieved by this method. regression analysis results of Table 3: Analysis for five groups of standard calibration curve fitting Original Fitting Line ρ F-test 0.989 492.5 914.16 0.994 1503.87 New Fitting Line ρ F-test 0.996 1152.58 10.27 0.998 3902.39 0.998 4284.72 0.997 4951.286 5.93 0.998 7038.23 Number of Eliminated Abnormal Point s s First set of data (n=10) Secord set of data (n=15) 0.992 Third set of data (n=20) Fourth set of data (n=25) 0.992 1732.57 10.81 Fifth set of data (n=30) 15.61 11.85 9.77 1 2 2 3 4 5.74 5.82 0.992 1909.44 10.79 5.68 In order to further verify the feasibility and the using effect of the data processing method based on NMR signal, we select the data of fitted standard calibration curves from 5 groups with sample capacity from 10 to 30, as shown in Table 3. First of all, observed from the related parameters of the original fitting line in each group data, the regression effect of the standard curve is significant in theory. However, due to the increase of sample size, the abnormal points in acquisition data may also increase. The simple least squares fitting and regression analysis for the data cannot effectively response the reliability of the data and the precision of the standard curve fitting. Secondly, after using the data processing method, the regression effect and the precision of the standard calibration curve have been further improved compared with the original method. Finally, according to the data of five groups in different sample size, it can be found that this method is suitable for data set with sample size3 included abnormal data. n 30 , and can identify and eliminate the To sum up, the spectrum signal processing method based on NMR can effectively restrain the result of the experiment caused by the error interference during the process of data collection, and verify that the effectiveness and feasibility of this method through experiment, as well as obviously improves the speed and the precision of the NMR rapid detection technology. CONCLUSION Standard calibration curve fitting can directly affect the accuracy of NMR detection results. The existing nuclear magnetic resonance instrument with data processing software can directly make simple fitting to the collected data, but it failed to test and control of the collected data, which reduced the reliability of the standard calibration curve fitting and directly affects the precision of detection. 405
Ying Liu et al ______________________________________________________________________________ J. Chem. Pharm. Res., 2014, 6(3):401-406 The proposed method of the NMR spectrum signal processing can eliminate the error, identify abnormal and great influential points, as well as eliminate the error caused by incorrect configuration of individual standard sample or the collected data. To control the reliability of the fitting results can effectively eliminate the interference of abnormal data to get better effect of standard calibration curve. According to the comparison with the original standard curve fitting methods, the advantages of spectrum signal processing method based on magnetic resonance are as follows: 1) Due to the limitation to the sample test influenced by NMR instrument (altitude of the sample in a test tube should be not less than 1 cm), the collected data points are mainly focused on the fitting scope with larger abscissa values. This method can test whether there is deviation in the tested data by the slope of each data point, which can simply and effectively avoid the defects of standard curve fitting caused by the lack of data of samples with smaller content. 2) Since we use NMR technology for rapid detection of the content of unknown samples, the collected sample size should not be too large. This method is suitable for data of small sample size (3 criterion to test deviation of the collected data. n 30 ), so we choose Dixon 3) This method can identify whether the data point relevant to the fitting standard calibration line is abnormal point through studentized residual, and measure its influence degree combined with the Cook 's D Statistic method, which will determine whether it should be eliminated or not, thereby eliminating the abnormal and great influential points. 4) This method can detect the deviation of the collected data of each group and its abnormal point and eliminate it, so it can be used to detect a data set which contains multiple abnormal data points at the same time, thus ensure that there will be no omissions to detect and eliminate the deviation and abnormal points. Acknowledgements This work was financially supported by National Natural Science Foundation of China (61101174). REFERENCES [1] Santosh K.B., Raja R. TrAC Trends in Analytical Chemistry,2012,35:5-26. [2] Henrik T.P., Lars M., Siren B.E.. JAOCS,2000,77(10):1069-1077. [3]Chaland B., Mariette F.,MarchalP,et al. Journal of Dairy Research,2000, 67(4):609-618. [4]Toussaint C., Medale F., Davenel A., et al. Journal of the Science of Food Agriculture, 2002, 82(2):173-178. [5] Barend J.T., Bert W.R.,Computing in Science and Engineering,2008,10(1) :49-59. [6] Jin Yisu, Yue Hong, Brown M., et al. New York:American Control Conference, 2007:2708 - 2713 . [7]Song Ruiyin, Li Wei, Yang Canjun, et al. IEEE International Conference on Control and Automation, 2007: 198-202. [8] Zhou Mengran, Li Zhenbi, Zhu Zongjiu.Electronic Measurement and Instruments,2007:195-199. [9] Skoog D.A., Holler F.J., Crouch S.R.. Principles of Instrumental Analysis.6th Edition, Brooks Cole, USA, 2007:533-535. 406