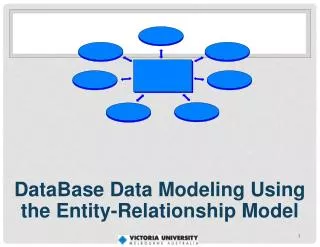
44220: Database Design & Implementation ER Diagramming
44220: Database Design & Implementation ER Diagramming. Ian Perry Room: C41C Tel Ext.: 7287 E-mail: I.P.Perry@hull.ac.uk http://itsy.co.uk/ac/0809/sem2/44220_DDI/. Conceptual Data Modelling Process. Identify ALL of the relevant Entities .

44220: Database Design & Implementation ER Diagramming
E N D
Presentation Transcript
44220: Database Design & ImplementationER Diagramming Ian Perry Room: C41C Tel Ext.: 7287 E-mail: I.P.Perry@hull.ac.uk http://itsy.co.uk/ac/0809/sem2/44220_DDI/
Conceptual Data Modelling Process • Identify ALL of the relevant Entities. • must play a necessary role in the business system. • Identify those Attributes that adequately describe each Entity. • remember to choose ‘key’ attribute(s). • Identify the Relationships between Entities. • determine the Degree of each Relationship: • determine the Type of each Relationship. • attempt to decompose any many-to-many Relationships that you have identified.
Hospital Example • Let us suppose that you have been asked to build a Conceptual Data Model for a Hospital. • The questions you must ask (and answer?) are as follows: • What are the major objects of interest? • Entities • What details adequately describe each of these objects? • Attributes • What associations are valid between these objects? • Relationships
What are the Entities? • i.e. the major objects of interest. • Doctor • Nurse • Ward • Patient • Medication • Operation • Clinic • etc.
What are the Attributes? • i.e. the details that adequately describe each of the Entities. • Ward • Name, Location, Number of Beds, … • Patient • Name, Address, Date-of-Birth, Gender, … • Doctor • Name, Room, Extension, Speciality, … • Nurse • Name, Room, Extension, Speciality, … • NB. • Perhaps ‘people’ who work in the Hospital could be described using ONE Entity, i.e. Staff?
Entity Definition • Syntax: • EntityName (key attribute(s), attribute, ...) • For Example: • Staff (FirstName, FamilyName, Role, Room, Extension, Speciality, …) • Ward (WardName, Location, Number-of-Beds, …) • Medication (DrugCode, Type, Dosage, …) • Patient (FirstName, FamilyName, DOB, Gender, Street, Town, Post Code, Tel. No., …) • Always Remember: • to indicate the ‘key’ Attribute(s).
‘Type’ of Relationships? • i.e. associations which are valid, in BOTH directions, between pairs of Entities. • PatienthasOperation. • Operationperformed onPatient • Staffwork in Ward • Ward employs Staff • Ward has beds for Patient • Patientstays inWard • PatientattendsClinic • ClinictreatsPatient • Etc.
‘Degree’ of Relationships? • One-to-One (1:1) • Very rare! • One-to-Many (1:M) • Quite rare as a ‘real world’ relationship; however, what we require for both Logical and Physical Modelling. • Many-to-Many (M:M) • Most common as a ‘real world’ relationship; however, impossible to implement Logically or Physically. • MUST be decomposed into two One-to-Many relationships linked by an ‘artificial’ Entity.
Occurrence Diagrams? 1 M M 1 1 M • Use these (with values for Key Attributes) to discover how many occurrences of each Entity are actually on either side of a Relationship. • Staff • Fred Smith • Jane Bloggs • Arthur Jones • Angela Oust Ward Ward 1 Ward 2 Ward 3
Participation in a Relationship? • Mandatory: • compulsory attachment on both sides (very rare). • Contingent: • compulsion on one side only (most common). • Optional: • no compulsory attachment for either Entity (rare). • Inclusive: • attachment only occurs when another relationship exists (very rare). • Exclusive: • only one attachment from a set of possible relationships is permitted (quite rare).
Degree, Type & Participation - 1 • One-to-Many, Contingent (compulsion one side) has beds for => 1 M Ward Patient <= stays in • One-to-Many, Contingent (compulsion one side) treats => 1 M Clinic Patient <= attends NB. a Patient can NOT both be staying in a Ward AND attending the Clinic, so these two Relationships are also Exclusive.
Degree, Type & Participation - 2 • Many-to-Many, Contingent (compulsion one side) has => M M Patient Operation <= performed on • Many-to-Many, Contingent (compulsion one side) work in => M M Staff Ward <= employs
Decompose Complex Relationships • Can’t have any Many-to-Many Relationships; for example this one: work in => M M Staff Ward <= employs • MUST be decomposed into 2 x One-to-Many Relationships, linked by an ‘artificial’ Entity, i.e.: M M 1 1 Ward Team Staff work in => <= employs FirstName FamilyName WardName FirstName FamilyName WardName
Rules for Drawing ER Diagrams • Need to look good: • So, DON’T draw them by hand! • Need to be well laid out, so that: • Entities with several Relationships are in the centre of the diagram. • AND related Entities are adjacent to each other. • AND Relationship lines do not cross.
The final Degree, Type & Participation Diags. M 1 1 M Team Ward Staff <= employs work in => treats => 1 M Clinic Patient 1 M M 1 Pat/Op Operation Patient <= attends has => <= performed on has beds for => 1 M Ward Patient <= stays in NB. the above Relationships are also Exclusive. i.e. having now ‘solved’ BOTHM:M Relationship ‘problems’.
Plan BEFORE you begin! • ‘Patient’ has Relationships with THREE other Entities: • so, place ‘Patient’ in centre of the Diagram. • ‘Ward’, ‘Team’ & ‘Pat/Op’ have Relationships with TWO other Entities: • so, place these a little further out. • The other 3 Entities (i.e. ‘Staff’, ‘Operation’ & ‘Clinic’ only have ONE Relationship: • so, they should be placed on the outside of the digaram, close to the Entity that they have a Relationship with. • Join all of the Entities: • indicating the Degree, Type and Participation of each Relationship.
ER Diagram for a Hospital has => Ward Clinic Team 1 M M 1 1 <= work in <= attends has beds for => <= stays in treats => 1 Staff #==========# M M Pat/Op Patient has => M 1 M <= performed on 1 Operation
This Week’s Workshop • The purpose of this week’s Workshop it to check that you can create good looking ER Diagrams, using a suitable software tool. • If you haven’t already got a favourite drawing application I suggest you use PowerPoint. • Your ER Diagrams MUST follow the diagram conventions given in this lecture. • The same is true for Assignment 1. • Part 1 - Draw Degree, Type & Participation diagrams, which: • depict 4, relatively simple, ‘real-world’ situations. • Part 2 - Begin working on Assignment 1, by: • identifying the Entities from the Case Study. • then, drawing Occurrence diagrams for each Pair of Entities.