Download
1 / 1
10 likes | 117 Vues
Ecology of C 3 and C 4 Grasses (Poaceae) in the United States: a Phylogenetically Controlled Analysis. Patrick J. Alexander, Department of Biology, New Mexico State University, Las Cruces, NM, paalexan@nmsu.edu. Introduction:.

E N D
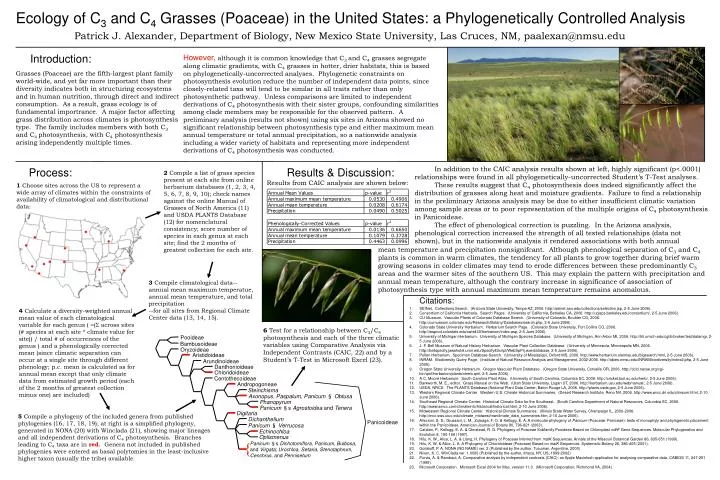
Ecology of C3 and C4 Grasses (Poaceae) in the United States: a Phylogenetically Controlled Analysis Patrick J. Alexander, Department of Biology, New Mexico State University, Las Cruces, NM, paalexan@nmsu.edu Introduction: However, although it is common knowledge that C3 and C4 grasses segregate along climatic gradients, with C4 grasses in hotter, drier habitats, this is based on phylogenetically-uncorrected analyses. Phylogenetic constraints on photosynthesis evolution reduce the number of independent data points, since closely-related taxa will tend to be similar in all traits rather than only photosynthetic pathway. Unless comparisons are limited to independent derivations of C4 photosynthesis with their sister groups, confounding similarities among clade members may be responsible for the observed pattern. A preliminary analysis (results not shown) using six sites in Arizona showed no significant relationship between photosynthesis type and either maximum mean annual temperature or total annual precipitation, so a nationwide analysis including a wider variety of habitats and representing more independent derivations of C4 photosynthesis was conducted. Grasses (Poaceae) are the fifth-largest plant family world-wide, and yet far more important than their diversity indicates both in structuring ecosystems and in human nutrition, through direct and indirect consumption. As a result, grass ecology is of fundamental importrance. A major factor affecting grass distribution across climates is photosynthesis type. The family includes members with both C3 and C4 photosynthesis, with C4 photosynthesis arising independently multiple times. In addition to the CAIC analysis results shown at left, highly significant (p<.0001) relationships were found in all phylogenetically-uncorrected Student’s T-Test analyses. These results suggest that C4 photosynthesis does indeed significantly affect the distribution of grasses along heat and moisture gradients. Failure to find a relationship in the preliminary Arizona analysis may be due to either insufficient climatic variation among sample areas or to poor representation of the multiple origins of C4 photosynthesis in Panicoideae. The effect of phenological correction is puzzling. In the Arizona analysis, phenological correction increased the strength of all tested relationships (data not shown), but in the nationwide analysis it rendered associations with both annual Results & Discussion: Results from CAIC analysis are shown below: Process: 2 Compile a list of grass species present at each site from online herbarium databases (1, 2, 3, 4, 5, 6, 7, 8, 9, 10); check names against the online Manual of Grasses of North America (11)and USDA PLANTS Database (12) for nomenclatural consistency; score number of species in each genus at each site; find the 2 months of greatest collection for each site. 1 Choose sites across the US to represent a wide array of climates within the constraints of availability of climatological and distributional data: mean temperature and precipitation nonsignifcant. Although phenological separation of C3 and C4 plants is common in warm climates, the tendency for all plants to grow together during brief warm growing seasons in colder climates may tend to erode differences between these predominantly C3 areas and the warmer sites of the southern US. This may explain the pattern with precipitation and annual mean temperature, although the contrary increase in significance of association of photosynthesis type with annual maximum mean temperature remains anomalous. 3 Compile climatological data--annual mean maximum temperatue, annual mean temperature, and total precipitation --for all sites from Regional Climate Center data (13, 14, 15). Citations: SEINet. Collections Search. (Arizona State University, Tempe AZ, 2006. http://seinet.asu.edu/collections/selection.jsp, 2-5 June 2006). Consortium of California Herbaria. Search Pages. (University of California, Berkeley CA, 2006. http://ucjeps.berkeley.edu/consortium/, 2-5 June 2006). CU Museum. Vascular Plants of Colorado Database Search. (University of Colorado, Boulder CO, 2006. http://cumuseum.colorado.edu/Research/Botany/Databases/search.php, 2-5 June 2006). Colorado State University Herbarium. Herbarium Search Page. (Colorado State University, Fort Collins CO, 2006. http://wsprod.colostate.edu/cwis440/herbarium/index.asp, 2-5 June 2006). University of Michigan Herbarium. University of Michigan Species Database. (University of Michigan, Ann Arbor MI, 2006. http://hti.umich.edu/cgi/b/broker/test/datamgr, 2-5 June 2006). J. F. Bell Museum of Natural History Herbarium. Vascular Plant Collection Database. (University of Minnesota, Minneapolis MN, 2006. http://bellspecify.jawshotel.umn.edu/Specify4Script/WebSpPrj.exe/database, 2-5 June 2006). Pullen Herbarium. Specimen Database Search. (University of Mississippi, Oxford MS, 2006. http://www.herbarium.olemiss.edu/bigsearch.html, 2-5 June 2006). INRAM. Biodiversity Query Page. (Institute of Natural Resource Analysis and Management, 2002-2006. http://abies.nmsu.edu/INRAM/biodiversity/index2.php, 2-5 June 2006). Oregon State University Herbarium. Oregon Vascular Plant Database. (Oregon State University, Corvallis OR, 2006. http://ocid.nacse.org/cgi-bin/qml/herbarium/plants/vherb.qml, 2-5 June 2006). A.C. Moore Herbarium. South Carolina Plant Atlas. (University of South Carolina, Columbia SC, 2006. http://cricket.biol.sc.edu/herb/, 2-5 June 2006). 11. Barkworth, M. E., editor. Grass Manual on the Web. (Utah State University, Logan UT, 2006. http://herbarium.usu.edu/webmanual/, 2-5 June 2006). USDA, NRCS. The PLANTS Database (National Plant Data Center, Baton Rouge LA, 2006. http://plants.usda.gov, 2-5 June 2006). Western Regional Climate Center. Western U.S. Climate Historical Summaries. (Desert Research Institute, Reno NV, 2006. http://www.wrcc.dri.edu/climsum.html, 2-10 June 2006). Southeast Regional Climate Center. Historical Climate Data for the Southeast. (South Carolina Department of Natural Resources, Columbia SC, 2006. http://www.sercc.com/climateinfo/historical/historical.html, 2-10 June 2006). Midwestern Regional Climate Center. Historical Climate Summaries. (Illinois State Water Survey, Champaign IL, 2000-2006. http://mcc.sws.uiuc.edu/climate_midwest/mwclimate_data_summaries.htm, 2-10 June 2006). Aliscioni, S. S., Giussani, L. M., Zuloaga, F. O. & Kellogg, E. A. A molecular phylogeny of Panicum (Poaceae: Paniceae): tests of monophyly and phylogenetic placement within the Panicoideae. American Journal of Botany 90, 796-821 (2003). Catalan, P., Kellogg, E. A. & Olmstead, R. G. Phylogeny of Poaceae Subfamily Pooideae Based on Chloroplast ndhF Gene Sequences. Molecular Phylogenetics and Evolution 8, 150-166 (1997). Hilu, K. W., Alice, L. A. & Liang, H. Phylogeny of Poaceae Inferred from matK Sequences. Annals of the Missouri Botanical Garden 86, 835-651 (1999). Hilu, K. W. & Alice, L. A. A Phylogeny of Chloridoideae (Poaceae) Based on matK Sequences. Systematic Botany 26, 386-405 (2001). Goloboff, P. A. NONA (NO NAME) ver. 2 (Published by the author, Tucuman, Argentina, 2000) Nixon, K. C. WinClada ver. 1.0000 (Published by the author, Ithaca, NY, US, 1999-2002) Purvis, A. & Rambaut, A. Comparative analysis by independent contrasts (CAIC): an Apple Macintosh application for analysing comparative data. CABIOS 11, 247-251 (1995). 23. Microsoft Corporation. Microsoft Excel 2004 for Mac, version 11.0. (Microsoft Corporation, Richmond VA, 2004). 4 Calculate a diversity-weighted annual mean value of each climatological variable for each genus ( =( across sites (# species at each site * climate value for site)) / total # of occurrences of the genus ) and a phenologically corrected mean (since climatic separation can occur at a single site through different phenology; p.c. mean is calculated as for annual mean except that only climate data from estimated growth period (each of the 2 months of greatest collection minus one) are included) 6 Test for a relationship between C3/C4 photosynthesis and each of the three climatic variables using Comparative Analysis via Independent Contrasts (CAIC, 22) and by a Student’s T-Test in Microsoft Excel (23). Pooideae Bambusoideae Oryzoideae Aristidoideae Arundinoideae Danthonioideae Chloridoideae Centothecoideae Andropogoneae Steinchisma Axonopus, Paspalum, Panicum § Obtusa Phanopyrum Panicum §s Agrostoidea and Tenera Digitaria 5 Compile a phylogeny of the included genera from published phylogenies (16, 17, 18, 19); at right is a simplified phylogeny, generated in NONA (20) with Winclada (21), showing major lineages and all independent derivations of C4 photosynthesis. Branches leading to C4 taxa are in red. Genera not included in published phylogenies were entered as basal polytomies in the least-inclusive higher taxon (usually the tribe) available. Dichanthelium Panicoideae Panicum § Verrucosa Echinochloa Oplismenus { Panicum §s Dichotomiflora, Panicum, Bulbosa, and Virgata; Urochloa, Setaria, Stenotaphrum, Cenchrus, and Pennisetum