1 / 2
20 likes | 38 Vues
FKB_ Product Mix and Revenue Drivers v2 Spreadsheet

E N D
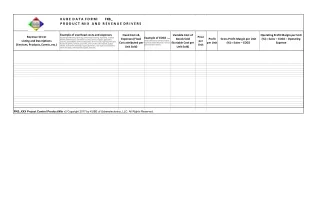
K U B E D A T A F O R M: FKB_ P R O D U C T M I X A N D R E V E N U E D R I V E R S Example of overhead costs and expenses: Accounting/bookkeeping, advertising, conferences and training, depreciation, employee benefits, health insurance, entertainment, business lunches, employee appreciation, insurance, general liability, workers compensation, interest on loans, legal and professional licenses and permits, merchant account fees, credit card fees, office expense, postage, internet, phone service, technology support, payroll taxes, rent, repairs and maintenance, salaries and wages, small equipment, supplies, and travel. Fixed Costs & Expenses (Fixed Cost attributed per Unit Sold) Variable Cost of Goods Sold (Variable Cost per Unit Sold) Operating Profit Margin per Unit (%) = Sales – COGS – Operating Expense Revenue Driver Listing and Descriptions (Services, Products, Events, etc.) Price per Unit Example of COGS: Costs directly attributed to materials and labor required to produce the goods or services provided by your company. Profit per Unit Gross Profit Margin per Unit (%) = Sales – COGS FKB_XXX Project Control Product Mix v2 Copyright 2017 by KUBE of Urbanetectonics, LLC. All Rights Reserved.
K U B E D A T A F O R M: FKB_ P R O D U C T M I X A N D R E V E N U E D R I V E R S Revenue Driver Listing and Descriptions (Services, Products, Events, etc.) Annual Gross Profit = Revenue -Variable Costs or COGS Projected # of Units per Year Projected Sales and Revenue Per Month Projected Sales and Revenue Per Quarter Projected Sales and Revenue Per Year Annual Operating or Net Income = Gross Profit -Fixed Costs Annual Projected Net Profit FKB_XXX Project Control Product Mix v2 Copyright 2017 by KUBE of Urbanetectonics, LLC. All Rights Reserved.