Download
1 / 12
120 likes | 132 Vues
Read More: https://bit.ly/2A8Yg3c<br><br>Americau2019s search for leading edge fabs: The recent battles between China and America have tended to not be framed by the semiconductor issue. Instead they have centered on trade and jobs, with the Coronavirus an emergent hot point.

E N D
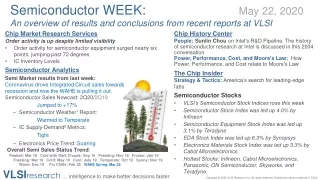
Semiconductor WEEK: May 22, 2020 An overview of results and conclusions from recent reports at VLSI Chip Market Research Services Order activity is up despite limited visibility • Order activity for semiconductor equipment surged nearly six points, jumping past 72 degrees • IC Inventory Levels Semiconductor Analytics Semi Market results from last week: Coronavirus drove Integrated Circuit sales towards recession and now the WAHE is pulling it out. Semiconductor Sales Nowcast: 2Q20/2Q19 Jumped to +17% – Semiconductor Weather1Report: Warmed to Temperate – IC Supply-Demand2Metrics: Tight – Electronics Price Trend: Soaring Overall Semi Sales Status Trend: Peaked: Mar 18 Cold with Dark Clouds: Sep 18 Freezing: Nov 18 Frozen: Jan 19 Freezing: Mar 19 Cold: May 19 Cool: July 19 Temperate: Oct 19 Sunny: Nov 19 Warm: Dec 19 Flu Chills: Feb 28 WAHE Spring: Mar 25 Chip History Center People: Sunlin Chou on Intel's R&D Pipeline. The history of semiconductor research at Intel is discussed in this 2004 conversation Power, Performance, Cost, and Moore's Law: How Power, Performance, and Cost relate to Moore's Law The Chip Insider Strategy & Tactics: America’s search for leading-edge fabs Semiconductor Stocks • VLSI’s Semiconductor Stock Indices rose this week • Semiconductor Stock Index was led up 4.0% by Infineon • Semiconductor Equipment Stock Index was led up 3.1% by Teradyne • EDA Stock Index was led up 6.3% by Synopsys • Electronics Materials Stock Index was led up 3.3% by Cabot Microelectronics • Hottest Stocks: Infineon, Cabot Microelectronics, Panasonic, ON Semiconductor, Skyworks, and Teradyne. VLSIresearch … intelligence to make better decisions faster Copyright © 2020 VLSI Research Inc. All rights reserved. Distribution rights contained in T&Cs.
The Chip Insider®'s Graphics File May 2020 Order activity is up despite limited visibility Order activity for semiconductor equipment surged nearly six points, jumping past 72 degrees Despite the uncertainty from the COVID-19 pandemic, demand for equipment remains solid as semiconductor companies continue to push forward with their capacity upgrades and additions plans Working from home economy coupled with surging e- commerce has offset the weakness in other sectors like automotive and industrial There have been some major changes to the forecasts in this update – Equipment sales are now expected to increase 7% compared to our previous forecast of -6%. – IC sales are expected to increase nearly 1% compared to -4% in the previous update • VLSI’s Chip Price Performance Index (CPPI) slipped further • • • • This issue contains the latest forecast. VLSIresearch … intelligence to make better decisions faster Call us to access more details Copyright © 2020 VLSI Research Inc. All rights reserved. Distribution rights contained in T&Cs.
VLSI's Current Forecast Forecast as of May 2020: Semi Equipment ($B): Sequential Change Capacity Utilization: ICs ($B): Sequential Change IC Units (BU): Sequential Change Electronics ($B) : Sequential Change 2021 88.1 $ 6.5% 95.2% 408.6 $ 15.2% 334.4 12.8% 2,284 $ 13.0% 4Q19 21.3 $ 10.3% 87.4% 94.0 $ 3.6% 77.4 -1.8% 631.5 $ 20.6% 2019 77.0 $ -8.0% 84.6% 352.3 $ -13.4% 299.4 -6.0% 2,122 $ -2.0% 2020 82.7 $ 7.3% 88.6% 354.8 $ 0.7% 296.4 -1.0% 2,020 $ -4.8% Severe COVID-19 impact in 2H20, recovery 2021 Forecast as of May 2020: Semi Equipment ($B): Sequential Change ICs ($B): Sequential Change IC Units (BU): Sequential Change Electronics ($B) : Sequential Change 2021 88.1 $ 23.8% 408.6 $ 23.5% 334.4 20.9% 2,284 $ 21.2% 4Q19 21.3 $ 10.3% 94.0 $ 3.6% 77.4 -1.8% $ 20.6% 2019 77.0 $ -8.0% 352.3 $ -13.4% 299.4 -6.0% 2,122 $ -2.0% 2020 71.2 $ -7.6% 330.8 $ -6.1% 276.6 -7.6% 1,884 $ -11.2% 632 VLSIresearch … intelligence to make better decisions faster Copyright © 2020 VLSI Research Inc. All rights reserved. Distribution rights contained in T&Cs.
The Chip Insider®Graphics Total IC inventories are much healthier than expected in 1H20 IC Inventory Levels: chart gives rolling averages for semiconductor integrated circuit inventories held at OEMs, in Die Banks, and the total Inventory-to-Billing Ratio VLSIresearch … intelligence to make better decisions faster Copyright © 2020 VLSI Research Inc. All rights reserved. Distribution rights contained in T&Cs.
Semiconductor Analytics Last Week in the Semiconductor Market: The Coronavirus drove Integrated Circuit sales towards recession and now the WAHE is pulling it out. Semiconductor sales continued to run well above 2019 levels last week, with a 2nd half revenue ramp similar to 2018. W/W: Week-over-Week sequential growth W/Q: Week-over-Quarter W/Y: Week-over-Year Semiconductor Sales Nowcast: 2Q20/2Q19 Jumped to +17% Semiconductor Weather1Report: 70˚ F Warmed to Temperate IC Supply-Demand2Metrics: Tight Electronics Pricing Trend: Soaring Notebooks, Smartphones, and Consumer Electronics have a seasonal inversion driven by WAHE (Work-at-Home Economy) Thank you for supporting us through this last issue of 2018. Semiconductor Analytics will return January . Overall Semi Sales Status Trend: Peaked: Mar 18 Cold with Dark Clouds: Sep 18 Freezing: Nov 18 Frozen: Jan 19 Freezing: Mar 19 Cold: May 19 Cool: July 19 Temperate: Oct 19 Sunny: Nov 19 Warm: Dec 19 Flu Chills: Feb 28 WAHE Spring: Mar 25 1: Measures Order Activity 2: Measures Pricing Power VLSIresearch … intelligence to make better decisions faster 5 Copyright © 2020 VLSI Research Inc. All rights reserved. Distribution rights contained in T&Cs.
2020 Semiconductor Market Drivers Coronavirus drove Integrated Circuit sales towards recession and WAHE is pulling it out: • Certainties: – Coronavirus Pandemic infected economies • Unparalleled Supply and Demand shocks to IC sales of <10% and units of ~20% – Macroeconomic ‘V’acuum or ‘U’ – not ‘L’ – World’s Economy saved by Semiconductors – WAHE (Work-At-Home Economy) – 7/10nm and 5/7nm demand ramps • Uncertainties: – Ability of Governments to defibrillate economy out of shelter-in-place – 2020 Elections in U.S. VLSIresearch … intelligence to make better decisions faster 6 Copyright © 2020 VLSI Research Inc. All rights reserved. Distribution rights contained in T&Cs.
The Chip Insider® Strategy & Tactics Strategy and Tactics: America’s search for leading-edge fabs. Summaries: Important ChipChirps™ ChipChirps™ are exclusively available on VLSI’s App for Android and iOS America’s search for leading-edge fabs: The recent battles between China and America have tended to not be framed by the semiconductor issue. Instead they have centered on trade and jobs, with the Coronavirus an emergent hot point. But the semiconductor issue, often hidden, has been not too far below the surface because it is an existential threat to national security. As control over oil was the strategic national security fulcrum of the 20th century, semiconductors are for the 21st century. Of course, everyone in our industry knows this, yet... Silicon Shield: For Taiwan, its semiconductor strategy was conceived around a much more visible threat: America’s recognition of … Intel’s American Foundry Fab: The new story is… TSMC’s American Foundry Fab: China has a TSMC fab, why not America? One oft-stated reason for it… Taiwan: America’s 51st state? Now if you really want to think outside the box… weVISION Videos: COVID-19 & the Semi Value Chain with Risto Puhakka. Coronavirus impact on the semi value chain with Andrea Lati. Metrology and Inspection's increasing importance with Peter Jenkins of Infinitesima. The 2010 Decade: The Big Picture with Andrea Lati of VLSIresearch. weVISION Videos are available as downloadable podcasts on VLSI’s Smartphone app. “Execution is Everything” — John Doerr Contact us to get the full report and more VLSIresearch … intelligence to make better decisions faster Copyright © 2020 VLSI Research Inc. All rights reserved. Distribution rights contained in T&Cs.
semiStockWEEK: VLSI's Semiconductor Stock Indices rose along with the market. EDA index hit a new yearly high this week. Semiconductors 4%, Equipment 3%, EDA 6%, Electronic Materials 3%. VLSIresearch … intelligence to make better decisions faster Copyright © 2020 VLSI Research Inc. All rights reserved. Distribution rights contained in T&Cs.
Semiconductor Stocks: Weekly Growth and Forward P/E Ratios by Company VLSI’s Semiconductor Stock Index was led up 4.0% by Infineon, Panasonic, ON Semiconductor, and Skyworks. IDM +4.4% Foundry & OSAT -2.6% Fabless & Fablite +6.8% Weekly Gains 5/22/2020 Price Change Price Change Forward P/E Forward P/E Semiconductor Stocks Semiconductor Stocks IDM Fab-lite to Fabless Intel 13 AMD 1.8% 36 6.8% Micron 1.2% 9 Analog Devices 22 9.1% ON Semiconductor 10 Broadcom 12 11.2% 6.2% AMD AMDAnalog Devices ADIAmkorAMKR ASE ASXBroadcom AVGOIBMIBM Infineon IFNNY.PK Intel INTCJCET600584.SS Kingpak Technology6238.TWO Micron Technology MU On Semiconductor ONPanasonic PC MagnaChip Semiconductor MXMaxim MXIM MaxLinear MXLMediaTek 2454.TW NVIDIA NVDAQualcomm QCOM Samsung Electronics 005930.KS Silicon Laboratories SLABSkyworks SWKS SMIC SMI STMicroelectronics STM Texas Instruments TXNTSMC TSMUMC UMCWestern Digital WDCXilinx XLNX Samsung Electronics 1.9% IBM 1.2% 10 – SK hynix STMicroelectronics Western Digital Foundry & OSAT Amkor ASE -0.7% 2.1% 8.2% Infineon MagnaChip Semiconductor Maxim MaxLinear MediaTek NVIDIA 19 12 26 24 – 40 13.5% 8.2% 7.8% 8.3% 7.5% 6.3% 19 7 13 10 4.5% -6.8% JCET Kingpak Technology SMIC -5.3% 4.2% -11.7% 92 Panasonic Qualcomm Silicon Laboratories 34 13 29 11.4% 3.9% 4.2% – 1692 TSMC UMC 0.0% -3.0% 16 13 Skyworks Texas Instruments Xilinx 17 23 26 10.2% 4.8% 4.0% VLSIresearch … intelligence to make better decisions faster Copyright © 2020 VLSI Research Inc. All rights reserved. Distribution rights contained in T&Cs.
Chip Equipment & Related Stocks: Weekly Growth and Forward P/E Ratios by Company VLSI’s Semiconductor Equipment Stock Index was led up 3.1% by Teradyne. WFE +3.9% Test +4.3% Assembly -0.1% Weekly Gains 0 5/22/2020 Price Change Price Change Forward P/E Forward P/E Equipment Stocks Equipment Stocks Wafer Process: Applied Materials ASM International Test: Advantest Teradyne 13 19 -1.3% 10.3% 4.5% 4.1% – 18 ASML KLA 29 17 FormFactor 21 9.2% 3.3% 3.8% Applied Materials AMAT Advantest ATEYY ASM International ASMI ASM Lithography ASML ASM Pacific 0522.HK BE Semiconductor BESIY.PK FormFactorFORMKLA KLAC Kulicke & Soffa KLIC Lam Research LRCX Onto Innovation ONTONikon 7731 Teradyne TER Tokyo Electron Limited 8035 Veeco VECO Lam Research Onto Innovation 3.7% 3.3% 15 – Assembly: BESI 1.1% – Nikon TEL Veeco Instruments 3.3% -1.8% 5.3% Kulicke & Soffa ASM Pacific Technology 13 6.6% -7.9% – – 13 VLSIresearch … intelligence to make better decisions faster Copyright © 2020 VLSI Research Inc. All rights reserved. Distribution rights contained in T&Cs.
Electronic Materials Stocks: Weekly Growth and Forward P/E Ratios by Company VLSI’s EDA Stock Index was led up 6.3% by Synopsys, hitting a new high for the year. Weekly Gains EDA & Electronic Materials Stocks 5/22/2020 Price Change Price Change EDA & Electronic Materials Stocks Forward P/E Forward P/E EDA Cadence Synopsys Electronic Materials BASF Cabot Microelectronics DNP DuPont JSR Shin-Etsu SOITEC Tokyo Ohka 2.8% 7.1% -0.1% -0.2% -0.1% -2.5% – 4 – – – – VLSI’s Electronics Materials Stock Index was led up 3.3.% by Cabot Microelectronics. 32 29 4.8% 7.8% 2 6.8% 12.6% BASF BASFY Cadence CNDS DNP 7912 JSR 4185 SOI.PA Synopsys SNPS Cabot Microelectronics CCMP DuPont DD Shin-Etsu 4063 SOITEC Tokyo Ohka 4186 18 VLSIresearch … intelligence to make better decisions faster Copyright © 2020 VLSI Research Inc. All rights reserved. Distribution rights contained in T&Cs.
Companies Companies Max Growth Weekly Growth VLSI’s Indices of Chip Industry Stocks Min Growth Range of S&P 500 S&P 500 The Prior Week's Close Growth Growth Down Up Semi Stocks Equipment Stocks Materials Stocks EDA Stocks Semi Stocks Equipment Stocks Materials Stocks EDA Stocks 18-Oct-19 25-Oct-19 01-Nov-19 08-Nov-19 15-Nov-19 22-Nov-19 29-Nov-19 06-Dec-19 13-Dec-19 20-Dec-19 27-Dec-19 03-Jan-20 10-Jan-20 17-Jan-20 24-Jan-20 31-Jan-20 07-Feb-20 14-Feb-20 21-Feb-20 28-Feb-20 06-Mar-20 13-Mar-20 20-Mar-20 27-Mar-20 03-Apr-20 10-Apr-20 17-Apr-20 24-Apr-20 01-May-20 08-May-20 15-May-20 22-May-20 86.2 88.2 90.3 91.7 92.0 90.0 90.9 92.6 96.7 99.2 100.0 100.3 101.5 104.7 106.1 98.4 102.5 106.5 103.7 93.1 91.8 81.1 69.6 78.3 77.1 85.6 89.1 88.7 89.1 94.8 91.4 95.1 86.7 92.4 92.6 94.9 97.0 92.0 93.7 94.7 98.0 99.9 100.0 100.2 100.9 104.8 105.1 98.4 101.3 106.6 99.3 90.4 91.0 78.3 65.2 78.7 73.4 84.0 88.4 86.1 83.9 91.9 87.1 89.8 97.5 100.0 101.2 103.2 101.5 98.7 96.7 95.5 100.0 100.1 100.0 98.9 99.2 101.0 100.5 96.0 100.4 101.0 98.1 85.5 84.8 71.0 67.0 76.6 72.6 82.6 82.7 82.5 85.0 88.4 86.8 89.7 94.5 94.9 94.8 96.1 97.6 95.9 100.1 95.5 96.9 99.6 100.0 100.5 104.7 106.4 107.8 103.8 107.2 114.2 106.4 96.2 95.1 90.7 78.4 88.7 89.9 99.7 111.3 111.9 107.5 115.9 115.1 122.3 0.2% 2.4% 2.4% 1.5% 0.4% -2.2% 1.0% 1.8% 4.5% 2.6% 0.8% 0.3% 1.2% 3.2% 1.3% -7.3% 4.2% 3.9% -2.6% -10.2% -1.5% -11.6% -14.2% 12.6% -1.6% 11.1% 4.0% -0.4% 0.5% 6.4% -3.6% 4.0% 0.3% 6.6% 0.2% 2.5% 2.1% -5.1% 1.8% 1.1% 3.5% 1.9% 0.1% 0.2% 0.7% 3.9% 0.3% -6.3% 2.9% 5.3% -6.9% -8.9% 0.6% -13.9% -16.7% 20.6% -6.7% 14.5% 5.2% -2.6% -2.6% 9.6% -5.3% 3.1% 2.7% 2.5% 1.3% 1.9% -1.6% -2.8% -2.0% -1.2% 4.7% 0.1% -0.1% -1.1% 0.2% 1.8% -0.5% -4.5% 4.6% 0.6% -2.8% -12.9% -0.7% -16.3% -5.7% 14.4% -5.3% 13.8% 0.2% -0.2% 3.1% 3.9% -1.8% 3.3% -1.5% 0.4% -0.1% 1.3% 1.6% -1.8% 4.4% -4.6% 1.5% 2.7% 0.4% 0.5% 4.2% 1.7% 1.3% -3.8% 3.3% 6.5% -6.9% -9.5% -1.2% -4.6% -13.6% 13.1% 1.4% 10.9% 11.7% 0.6% -4.0% 7.8% -0.7% 6.3% 28 46 36 37 31 7 37 33 48 39 29 23 32 45 29 3 45 47 6 0 18 0 3 52 14 54 41 17 27 52 10 42 11.2% 15.6% 9.9% 12.5% 10.8% 5.7% 5.0% 8.2% 10.7% 12.5% 5.9% 9.5% 7.2% 19.1% 14.9% 2.2% 21.4% 27.5% 4.5% -0.8% 7.9% -2.1% 15.3% 36.1% 17.4% 38.2% 17.0% 9.2% 19.1% 31.0% 16.8% 13.5% -23 -7 -15 -14 -20 -44 -14 -19 -3 -13 -23 -24 -22 -10 -25 -51 -10 -8 -49 -55 -35 -55 -52 -3 -41 -1 -10 -37 -28 -3 -45 -12 -6.0% -16.3% -12.1% -4.2% -5.0% -17.7% -15.0% -4.8% -1.4% -8.4% 2.7% -3.4% -4.8% -3.8% -10.8% -17.7% -11.7% -10.0% -17.1% -21.3% -11.0% -26.6% -28.9% -11.7% -15.1% -2.3% -6.1% -9.8% -11.9% -2.4% -21.1% -11.7% 17.2% 31.9% 22.0% 16.7% 15.8% 23.4% 20.0% 13.0% 12.1% 20.9% 8.6% 12.9% 12.0% 22.9% 25.7% 19.9% 33.1% 37.5% 21.6% 20.5% 18.9% 24.5% 44.2% 47.8% 32.5% 40.5% 23.1% 19.0% 31.0% 33.4% 37.9% 25.2% 92.2 93.3 94.7 95.5 96.3 96.0 96.9 97.1 97.8 99.4 100.0 99.8 100.8 102.8 101.7 99.5 102.7 104.3 103.0 91.2 91.7 83.7 71.1 78.4 76.8 86.1 88.7 87.6 87.4 90.4 88.4 91.2 0.5% 1.2% 1.5% 0.9% 0.9% -0.3% 1.0% 0.2% 0.7% 1.7% 0.6% -0.2% 0.9% 2.0% -1.0% -2.1% 3.2% 1.6% -1.3% -11.5% 0.6% -8.8% -15.0% 10.3% -2.1% 12.1% 3.0% -1.3% -0.2% 3.5% -2.3% 3.2% VLSIresearch … intelligence to make better decisions faster Copyright © 2020 VLSI Research Inc. All rights reserved. Distribution rights contained in T&Cs.