Download
1 / 14
140 likes | 156 Vues
Semiconductor sales recovered for the fifth week in a row, hugging 2018 levels. So far, the 2nd half production ramp looks normal. The Semiconductor Supply-Demand rose to Tight. NAND, Logic, and DRAM are being heavily driven by WAHE investments as Electronics Pricing soars.

E N D
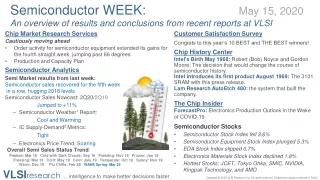
Semiconductor WEEK: May 15, 2020 An overview of results and conclusions from recent reports at VLSI Chip Market Research Services Cautiously moving ahead • Order activity for semiconductor equipment extended its gains for the fourth straight week, jumping past 66 degrees • Production and Capacity Plan Semiconductor Analytics Semi Market results from last week: Semiconductor sales recovered for the fifth week in a row, hugging 2018 levels Semiconductor Sales Nowcast: 2Q20/2Q19 Jumped to +11% – Semiconductor Weather1Report: Cool and Warming – IC Supply-Demand2Metrics: Tight – Electronics Price Trend: Soaring Overall Semi Sales Status Trend: Peaked: Mar 18 Cold with Dark Clouds: Sep 18 Freezing: Nov 18 Frozen: Jan 19 Freezing: Mar 19 Cold: May 19 Cool: July 19 Temperate: Oct 19 Sunny: Nov 19 Warm: Dec 19 Flu Chills: Feb 28 WAHE Spring: Mar 25 Customer Satisfaction Survey Congrats to this year’s 10 BEST and THE BEST winners! Chip History Center Intel's Birth May 1968: Robert (Bob) Noyce and Gordon Moore: The decision that would change the course of semiconductor history. Intel introduces its first product August 1969: The 3101 SRAM with this press release. Lam Research AutoEtch 480: the system that built the company. The Chip Insider ForecastPro: Electronics Production Outlook in the Wake of COVID-19 Semiconductor Stocks • Semiconductor Stock Index fell 3.6% • Semiconductor Equipment Stock Index plunged 5.3% • EDA Stock Index slipped 0.7% • Electronics Materials Stock Index declined 1.8% • Hottest Stocks: JCET, Tokyo Ohka, SMIC, NVIDIA, Kingpak Technology, and AMD VLSIresearch … intelligence to make better decisions faster Copyright © 2020 VLSI Research Inc. All rights reserved. Distribution rights contained in T&Cs.
The Chip Insider®'s Graphics File April 2020 Cautiously moving ahead • Order activity for semiconductor equipment extended its gains for the fourth straight week, jumping past 66 degrees • Despite ongoing uncertainty, the equipment market is on track for a strong Q2 with sales expected to increase by mid-single digits (more details coming in next week’s monthly update) • Advanced Logic & Foundry and China remain the brightest spots offsetting the weakness in Memory and DAO • The monthly data for April from the Taiwanese manufacturers was very positive; however, the momentum slowed down following a hot March • VLSI’s Chip Price Performance Index (CPPI) slipped further This issue contains the latest forecast. VLSIresearch … intelligence to make better decisions faster Call us to access more details Copyright © 2020 VLSI Research Inc. All rights reserved. Distribution rights contained in T&Cs.
Mild COVID-19 impact, recovery 3Q20--VLSI Forecast Forecast as of March 2020: Semi Equipment ($B): Sequential Change Capacity Utilization: ICs ($B): Sequential Change IC Units (BU): Sequential Change Electronics ($B) : Sequential Change 2021 84.9 $ 17.6% 89.1% 418.0 $ 24.0% 342.1 20.1% 2,362 $ 16.9% 2019 $ -8.0% 84.6% 352.3 $ -13.4% 299.4 -6.0% 2,122 $ -2.0% 2020 72.2 $ -6.3% 82.9% 337.1 $ -4.3% 284.9 -4.9% 2,020 $ -4.8% 77.0 Moderate COVID-19 impact, recovery in 4Q20 Forecast as of March 2020: Semi Equipment ($B): Sequential Change ICs ($B): Sequential Change IC Units (BU): Sequential Change Electronics ($B) : Sequential Change Severe COVID-19 impact, recovery 1Q21 Forecast as of March 2020: Semi Equipment ($B): Sequential Change ICs ($B): Sequential Change IC Units (BU): Sequential Change Electronics ($B) : Sequential Change 2021 84.9 $ 33.9% 418.0 $ 37.9% 342.1 34.1% 2,362 $ 25.3% 2021 84.9 $ 52.4% 418.0 $ 48.1% 342.1 43.7% 2,362 $ 35.8% 2019 $ -8.0% 352.3 $ -13.4% 299.4 -6.0% 2,121.9 $ -2.0% 2020 63.4 $ -17.7% 303.1 $ -14.0% 255.1 -14.8% 1,885 $ -11.2% 2019 $ -8.0% 352.3 $ -13.4% 299.4 -6.0% 2,122 $ -2.0% 2020 55.7 $ -27.7% 282.2 $ -19.9% 238.1 -20.5% 1,739 $ -18.0% 77.0 77.0 VLSIresearch … intelligence to make better decisions faster Copyright © 2020 VLSI Research Inc. All rights reserved. Distribution rights contained in T&Cs.
The Chip Insider®Graphics Production and Capacity Plan: • Production is falling as industry braces for impact from the pandemic Production and Capacity Plan: chart gives rolling averages for semiconductor production, currently active capacity and current plus planned capacity in millions of square inches of silicon wafers. VLSIresearch … intelligence to make better decisions faster Copyright © 2020 VLSI Research Inc. All rights reserved. Distribution rights contained in T&Cs.
Congrats to this year’s 10 BEST and THE BEST Winners 10 BEST News Release THE BEST News Release VLSIresearch … intelligence to make better decisions faster Copyright © 2020 VLSI Research Inc. All rights reserved. Distribution rights contained in T&Cs.
Semiconductor Analytics Last Week in the Semiconductor Market: Semiconductor sales recovered for the fifth week in a row, hugging 2018 levels. So far, the 2nd half production ramp looks normal. The Semiconductor Supply-Demand rose to Tight. NAND, Logic, and DRAM are being heavily driven by WAHE investments as Electronics Pricing soars. W/W: Week-over-Week sequential growth W/Q: Week-over-Quarter W/Y: Week-over-Year Semiconductor Sales Nowcast: 2Q20/2Q19 Jumped to +11% Semiconductor Weather1Report: 68˚ F Cool and Warming IC Supply-Demand2Metrics: Tight Electronics Pricing Trend: Soaring Notebooks, Smartphones, and Consumer Electronics have a seasonal inversion driven by WAHE (Work-at-Home Economy) Thank you for supporting us through this last issue of 2018. Semiconductor Analytics will return January . Overall Semi Sales Status Trend: Peaked: Mar 18 Cold with Dark Clouds: Sep 18 Freezing: Nov 18 Frozen: Jan 19 Freezing: Mar 19 Cold: May 19 Cool: July 19 Temperate: Oct 19 Sunny: Nov 19 Warm: Dec 19 Flu Chills: Feb 28 WAHE Spring: Mar 25 1: Measures Order Activity 2: Measures Pricing Power VLSIresearch … intelligence to make better decisions faster Copyright © 2020 VLSI Research Inc. All rights reserved. Distribution rights contained in T&Cs.
2020 Semiconductor Market Drivers Coronavirus has driven Integrated Circuit sales towards recession: • Certainties: – Coronavirus Pandemic infected economies • Unparalleled Supply and Demand shocks to IC sales of <10% and units of ~20% – Macroeconomic ‘V’acuum or ‘U’ – not ‘L’ – WAHE (Work-At-Home Economy) – 7/10nm and 5/7nm demand ramps – Memory Price Elasticity – 5G: Smartphone, Auto, Industrial • Uncertainties: – Ability of Governments to defibrillate economy out of shelter-in-place – 2020 Elections in U.S. VLSIresearch … intelligence to make better decisions faster Copyright © 2020 VLSI Research Inc. All rights reserved. Distribution rights contained in T&Cs.
The Chip Insider® ForecastPro Electronics Outlook • Changes since last forecast • Electronics Trends • Smartphone, Tablets, PC, Server Units • Electronics Segment Positions • VLSI’s view VLSIresearch … intelligence to make better decisions faster Copyright © 2020 VLSI Research Inc. All rights reserved. Distribution rights contained in T&Cs.
Electronics Production Outlook Changes Since Last Forecast • The outlook has changed dramatically since December 2019 due to COVID-19’s spread to a global pandemic • WGDP is collapsing from COVID-19 related shutdowns – Demand is dropping as populations get stay-in-place or quarantine orders throughout the world – 2Q GDP growth projections in U.S. are settling to -15% • One thing is clear: consumer, industrial, and service demand is dropping dramatically short-term We expect Electronics demand to drop in the wake of WGDP collapse All electronics segments have downgrades from previous forecast – Overall Electronics changing from +6% to -5% This is the single largest forecast change in last three years for VLSI – The largest changes usually correspond to large business disruptions such as 2009 financial crisis • • • Forecast Changes for 2020 (y-o-y growth) Dec-19 4.2% 8.4% 8.1% 9.5% 6.3% Mar-20 1.5% 5.6% 5.4% 6.8% 3.6% Apr-20 -6.7% -3.0% -3.2% -1.9% -4.8% Personal Tools IT Infrastructure Automotive Industrial Total Chart approved for public release with attribution. Copyright © VLSI Research Inc. All rights reserved. VLSIresearch … intelligence to make better decisions faster Copyright © 2020 VLSI Research Inc. All rights reserved. Distribution rights contained in T&Cs.
semiStockWEEK: VLSI's Semiconductor Stock Indices fell along with the market this week. Semiconductors -4%, Equipment -5%, EDA -1%, Electronic Materials -2%. VLSIresearch … intelligence to make better decisions faster Copyright © 2020 VLSI Research Inc. All rights reserved. Distribution rights contained in T&Cs.
Semiconductor Stocks: Weekly Growth and Forward P/E Ratios by Company VLSI’s Semiconductor Stock Index fell 3.6% despite claiming five of the top six stocks. IDM -7.4% Foundry & OSAT +1.7% Fabless & Fablite -4.4% Weekly Gains 5/15/2020 Price Change Price Change Semiconductor Stocks Semiconductor Stocks Forward P/E Forward P/E IDM Fab-lite to Fabless Intel 12 AMD 35 1.9% -2.3% Micron -8.0% 9 Analog Devices -7.3% 20 AMD AMDAnalog Devices ADIAmkorAMKR ASE ASXBroadcom AVGOIBMIBM Infineon IFNNY.PK Intel INTCJCET600584.SS Kingpak Technology6238.TWO Micron Technology MU On Semiconductor ONPanasonic PC MagnaChip Semiconductor MXMaxim MXIM MaxLinear MXLMediaTek 2454.TW NVIDIA NVDAQualcomm QCOM Samsung Electronics 005930.KS Silicon Laboratories SLABSkyworks SWKS SMIC SMI STMicroelectronics STM Texas Instruments TXNTSMC TSMUMC UMCWestern Digital WDCXilinx XLNX ON Semiconductor Samsung Electronics -17.3% -1.9% 9 – Broadcom IBM -5.3% -4.9% 11 9 SK hynix STMicroelectronics Western Digital Foundry & OSAT Amkor ASE JCET Infineon MagnaChip Semiconductor Maxim MaxLinear MediaTek NVIDIA Panasonic -7.2% -13.6% -3.8% -7.0% -0.1% 8.7% -1.7% 16 11 24 22 – 37 31 -3.6% -7.3% -11.3% 19 6 -7.3% -5.4% 16.8% 12 11 98 Kingpak Technology SMIC TSMC UMC Qualcomm Silicon Laboratories Skyworks Texas Instruments Xilinx -5.9% -9.7% -4.5% -5.9% -4.2% 13 28 15 22 25 3.1% 12.4% -5.9% -1.8% – 1916 16 13 VLSIresearch … intelligence to make better decisions faster Copyright © 2020 VLSI Research Inc. All rights reserved. Distribution rights contained in T&Cs.
Chip Equipment & Related Stocks: Weekly Growth and Forward P/E Ratios by Company VLSI’s Semiconductor Equipment Stock Index plunged 5.3%, BESI was this week’s biggest winner. WFE -5.3% Test -7.1% Assembly -4.3% Weekly Gains 0 5/15/2020 Price Change Price Change Equipment Stocks Equipment Stocks Forward P/E Forward P/E Wafer Process: Applied Materials ASM International ASML Test: Advantest Teradyne FormFactor 12 18 27 -3.3% 0.4% -3.9% -0.7% -12.6% -8.1% – 16 20 Applied Materials AMAT Advantest ATEYY ASM International ASMI ASM Lithography ASML ASM Pacific 0522.HK BE Semiconductor BESIY.PK FormFactorFORMKLA KLAC Kulicke & Soffa KLIC Lam Research LRCX Onto Innovation ONTONikon 7731 Teradyne TER Tokyo Electron Limited 8035 Veeco VECO KLA Lam Research 17 14 -2.4% -5.1% Assembly: Onto Innovation Nikon -7.5% -5.4% BESI Kulicke & Soffa 1.7% -9.7% – – – 13 TEL Veeco Instruments ASM Pacific Technology -5.0% 0.2% -21.1% – 12 VLSIresearch … intelligence to make better decisions faster Copyright © 2020 VLSI Research Inc. All rights reserved. Distribution rights contained in T&Cs.
Electronic Materials Stocks: Weekly Growth and Forward P/E Ratios by Company VLSI’s EDA Stock Index slipped 0.7% though both companies performed better than the weekly average. Weekly Gains 5/15/2020 Price Change Price Change -6.2% EDA & Electronic Materials Stocks Forward P/E EDA & Electronic Materials Stocks Forward P/E VLSI’s Electronics Materials Stock Index declined 1.8%, Tokyo Ohka came out on top. EDA DNP – Cadence Synopsys Electronic Materials BASF Cabot Microelectronics 31 27 DuPont JSR Shin-Etsu SOITEC Tokyo Ohka 4 – – – – -0.5% -0.9% -3.2% 1.6% -0.8% -0.8% 15.5% BASF BASFY Cadence CNDS DNP 7912 JSR 4185 SOI.PA Synopsys SNPS Cabot Microelectronics CCMP DuPont DD Shin-Etsu 4063 SOITEC Tokyo Ohka 4186 -7.3% -13.0% 2 16 VLSIresearch … intelligence to make better decisions faster Copyright © 2020 VLSI Research Inc. All rights reserved. Distribution rights contained in T&Cs.
Companies Companies Max Growth Weekly Growth VLSI’s Indices of Chip Industry Stocks Min Growth Range of S&P 500 S&P 500 The Prior Week's Close Growth Growth Down Up Semi Stocks Equipment Stocks Materials Stocks EDA Stocks Semi Stocks Equipment Stocks Materials Stocks EDA Stocks 11-Oct-19 18-Oct-19 25-Oct-19 01-Nov-19 08-Nov-19 15-Nov-19 22-Nov-19 29-Nov-19 06-Dec-19 13-Dec-19 20-Dec-19 27-Dec-19 03-Jan-20 10-Jan-20 17-Jan-20 24-Jan-20 31-Jan-20 07-Feb-20 14-Feb-20 21-Feb-20 28-Feb-20 06-Mar-20 13-Mar-20 20-Mar-20 27-Mar-20 03-Apr-20 10-Apr-20 17-Apr-20 24-Apr-20 01-May-20 08-May-20 15-May-20 86.0 86.2 88.2 90.3 91.7 92.0 90.0 90.9 92.6 96.7 99.2 100.0 100.3 101.5 104.7 106.1 98.4 102.5 106.5 103.7 93.1 91.8 81.1 69.6 78.3 77.1 85.6 89.1 88.7 89.1 94.8 91.4 86.4 86.7 92.4 92.6 94.9 97.0 92.0 93.7 94.7 98.0 99.9 100.0 100.2 100.9 104.8 105.1 98.4 101.3 106.6 99.3 90.4 91.0 78.3 65.2 78.7 73.4 84.0 88.4 86.1 83.9 91.9 87.1 95.0 97.5 100.0 101.2 103.2 101.5 98.7 96.7 95.5 100.0 100.1 100.0 98.9 99.2 101.0 100.5 96.0 100.4 101.0 98.1 85.5 84.8 71.0 67.0 76.6 72.6 82.6 82.7 82.5 85.0 88.4 86.8 96.0 94.5 94.9 94.8 96.1 97.6 95.9 100.1 95.5 96.9 99.6 100.0 100.5 104.7 106.4 107.8 103.8 107.2 114.2 106.4 96.2 95.1 90.7 78.4 88.7 89.9 99.7 111.3 111.9 107.5 115.9 115.1 1.7% 0.2% 2.4% 2.4% 1.5% 0.4% -2.2% 1.0% 1.8% 4.5% 2.6% 0.8% 0.3% 1.2% 3.2% 1.3% -7.3% 4.2% 3.9% -2.6% -10.2% -1.5% -11.6% -14.2% 12.6% -1.6% 11.1% 4.0% -0.4% 0.5% 6.4% -3.6% 2.3% 0.3% 6.6% 0.2% 2.5% 2.1% -5.1% 1.8% 1.1% 3.5% 1.9% 0.1% 0.2% 0.7% 3.9% 0.3% -6.3% 2.9% 5.3% -6.9% -8.9% 0.6% -13.9% -16.7% 20.6% -6.7% 14.5% 5.2% -2.6% -2.6% 9.6% -5.3% 2.0% 2.7% 2.5% 1.3% 1.9% -1.6% -2.8% -2.0% -1.2% 4.7% 0.1% -0.1% -1.1% 0.2% 1.8% -0.5% -4.5% 4.6% 0.6% -2.8% -12.9% -0.7% -16.3% -5.7% 14.4% -5.3% 13.8% 0.2% -0.2% 3.1% 3.9% -1.8% 0.0% -1.5% 0.4% -0.1% 1.3% 1.6% -1.8% 4.4% -4.6% 1.5% 2.7% 0.4% 0.5% 4.2% 1.7% 1.3% -3.8% 3.3% 6.5% -6.9% -9.5% -1.2% -4.6% -13.6% 13.1% 1.4% 10.9% 11.7% 0.6% -4.0% 7.8% -0.7% 35 28 46 36 37 31 7 37 33 48 39 29 23 32 45 29 3 45 47 6 0 18 0 3 52 14 54 41 17 27 52 10 9.0% 11.2% 15.6% 9.9% 12.5% 10.8% 5.7% 5.0% 8.2% 10.7% 12.5% 5.9% 9.5% 7.2% 19.1% 14.9% 2.2% 21.4% 27.5% 4.5% -0.8% 7.9% -2.1% 15.3% 36.1% 17.4% 38.2% 17.0% 9.2% 19.1% 31.0% 16.8% -15 -23 -7 -15 -14 -20 -44 -14 -19 -3 -13 -23 -24 -22 -10 -25 -51 -10 -8 -49 -55 -35 -55 -52 -3 -41 -1 -10 -37 -28 -3 -45 -4.4% -6.0% -16.3% -12.1% -4.2% -5.0% -17.7% -15.0% -4.8% -1.4% -8.4% 2.7% -3.4% -4.8% -3.8% -10.8% -17.7% -11.7% -10.0% -17.1% -21.3% -11.0% -26.6% -28.9% -11.7% -15.1% -2.3% -6.1% -9.8% -11.9% -2.4% -21.1% 13.4% 17.2% 31.9% 22.0% 16.7% 15.8% 23.4% 20.0% 13.0% 12.1% 20.9% 8.6% 12.9% 12.0% 22.9% 25.7% 19.9% 33.1% 37.5% 21.6% 20.5% 18.9% 24.5% 44.2% 47.8% 32.5% 40.5% 23.1% 19.0% 31.0% 33.4% 37.9% 91.7 92.2 93.3 94.7 95.5 96.3 96.0 96.9 97.1 97.8 99.4 100.0 99.8 100.8 102.8 101.7 99.5 102.7 104.3 103.0 91.2 91.7 83.7 71.1 78.4 76.8 86.1 88.7 87.6 87.4 90.4 88.4 0.6% 0.5% 1.2% 1.5% 0.9% 0.9% -0.3% 1.0% 0.2% 0.7% 1.7% 0.6% -0.2% 0.9% 2.0% -1.0% -2.1% 3.2% 1.6% -1.3% -11.5% 0.6% -8.8% -15.0% 10.3% -2.1% 12.1% 3.0% -1.3% -0.2% 3.5% -2.3% VLSIresearch … intelligence to make better decisions faster Copyright © 2020 VLSI Research Inc. All rights reserved. Distribution rights contained in T&Cs.