Hurricane Sandy Data Analytics
Hurricane Sandy Data Analytics. Han Dong Shujia Zhou IAB Meeting 2013. Outline. System Overview Data Collection and Cleaning Bag-Of-Words Model Topical Model Visualization Twitter Activity Graph Heat Map Conclusions Future Work. System Overview. Data Collection and Filtering.


Hurricane Sandy Data Analytics
E N D
Presentation Transcript
Hurricane Sandy Data Analytics Han Dong Shujia Zhou IAB Meeting 2013
Outline • System Overview • Data Collection and Cleaning • Bag-Of-Words Model • Topical Model Visualization • Twitter Activity Graph • Heat Map • Conclusions • Future Work
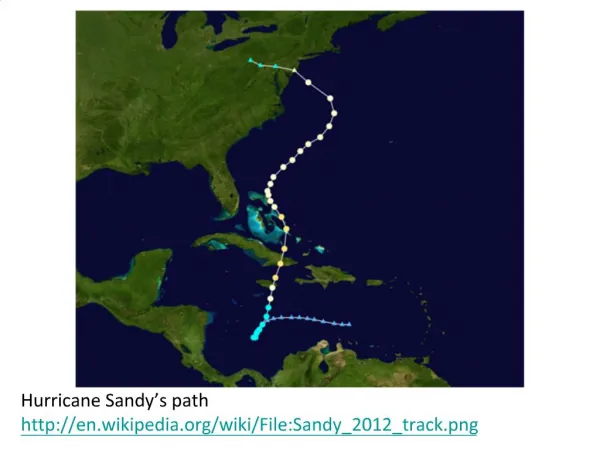
Data Collection and Filtering ~360,000 unique Twitter comments ~600 Mbytes of data
Heat Map October 26, 2012 October 26, 2012
Conclusion • Implemented a system to automate social media data extraction, processing and visualization.
Future Work • Apply the current data and system in another major hurricane this year.
This work was funded by NSF CHMPR through NOAA. We thank Ben Kyger for helpful discussions.