Proteomics
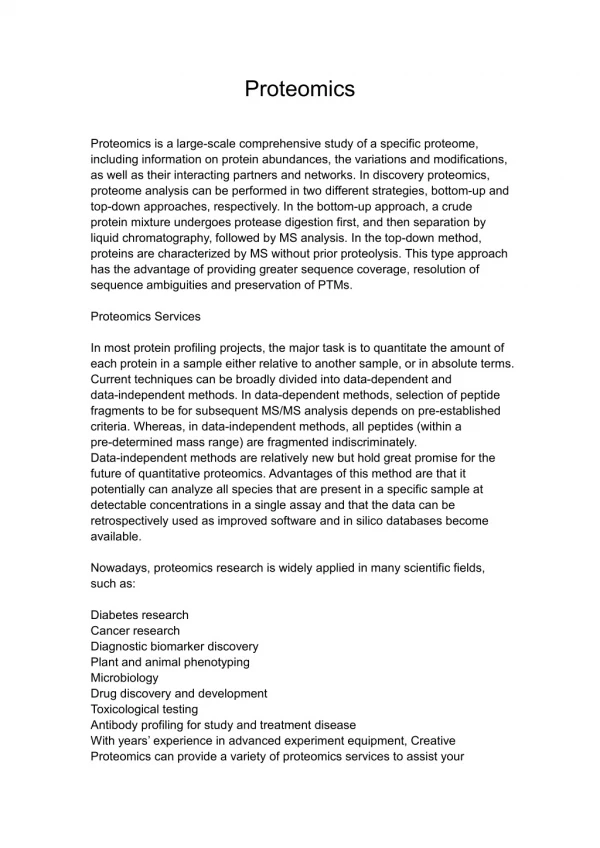
Deconvoluted spectrum 4000- 4100 Da Charge state measurable. Zoom-in of m/z 610 – 640 High dynamic range and sensitivity . 1 hour gradient. m/z. 881 peptide. Lysate_4mz_vydac_2nd_103001. #. 1475. RT:. 60.44. AV:. 1. NL:. 4.81E7. T:. + c ESI Full ms [ 780.00-1200.00]. RT:.


Proteomics
E N D
Presentation Transcript
Deconvoluted spectrum 4000- 4100 Da Charge state measurable Zoom-in of m/z 610 – 640 High dynamic range and sensitivity 1 hour gradient m/z 881 peptide Lysate_4mz_vydac_2nd_103001 # 1475 RT: 60.44 AV: 1 NL: 4.81E7 T: + c ESI Full ms [ 780.00-1200.00] RT: 0.00 - 183.59 100 NL: 100 1.14E9 90 Base Peak 90 m/z= 100.0-2000.0 80 MS 80 Rpal_Pellet_ 70 Total ion chromatogram Full_112402 70 MS @ 21min MS @ 34min 60 60 MS (full scan) at 60 .4 minutes 50 50 40 40 30 30 20 20 10 10 0 0 800 850 900 950 1000 1050 1100 1150 1200 0 20 40 60 80 100 120 140 160 180 Database Search Deconvoluted spectrum LC - MS/MS Algorithm Highly complex low abundance peptides resolved (base peak chromatogram) 1 hour gradient Lysate_4mz_vydac_2nd_103001 # 1476 RT: 60.46 AV: 1 NL: 5.23E5 T: + c d Full ms2 881.21@35.00 [ 230.00-2000.00] 100 90 80 70 60 Algorithm identifies the peptideas originating from a hypothetical ORF MS/MS spectra of 881 precursor 50 40 30 20 10 0 400 600 800 1000 1200 1400 1600 1800 2000 Total ion chromatogram Zoom-in of m/z 800 - 1000 MS @ 15 min Integration of HPLC-FTICR MS and HPLC-QIT MS2 to Achieve Enhanced Proteome CharacterizationChongle Pan1,2,3 Nathan VerBerkmoes1,3 Praveen Chandramohan2 Nagiza Samatova2,3 Robert Hettich1,31Chemical Sciences Division; 2Computer Science and Mathematics Division, Oak Ridge National Lab; 3Genome Science and Technology Graduate School, ORNL-University of Tennessee OVERVIEW LC QIT MS2 METHODS NANOLC-FTICR-MS METHODS AND RESULTS INTEGRATION METHODS AND RESULTS • Objectives Proteome characterization generally consists of peptide separation by high performance liquid chromatography (HPLC) and peptide identification by tandem mass spectrometry (MS/MS). We aim to enhance the specificity and sensitivity of peptide identification by in silico integrating nanoLC-FTICR-MS and nanoLC-QIT-MS/MS. • Methods • nanoLC-FTICR-MS: 1D reverse phase LC coupled online to IonSpec 9.4T FTICR with MS scans • nanoLC-QIT-MS/MS: 1D reverse phase LC coupled online to LCQ with data dependent MS/MS scans • in silico integration: Retention time normalization; peptide correlation by retention time and mass • Results • Development of a robust nanoLC-FTICR-MS system • Development of retention time normalization and peptide correlation • Demonstration of enhanced peptide identification from simple protein mixture digest Methods: • 1D-reverse phase Liquid Chromatography • Autosampler injection, LC packings FAMOS 50 ul • Preconcentration: 300 um x 5 mm C18 PepMap • RP-LC: Vydac 75 um id x 25 cm C18 nanocolumn • Nanospray • Tip: 10 um ID New Objective Picotip • Vendcap: -1800V Vtip: 0V Ventrance: -1800V • Distance: 3mm • FT ICR MS • 9.4 Tesla IonSpec • 2 sec. hexapole ion accumulation • 256K data points @ 1Mhz ADC • 2-scan signal averaging, ~ 9 sec. per spectrum Results • Standard protein mixture tryptic digest • Constituents: ALCOHOL DEHYDROGENASE I and II, CARBONIC ANHYDRASE, HEMOGLOBIN A and B chains, MYOGLOBIN, LYSOZYME C, SERUM ALBUMIN • Rhodopseudomonas palustris proteome cleared fraction (Soluble proteins) • 3 consecutive nanoLC- FTICR MS runswith proteome samples • Parallel LC/MS experiments • Data process and extraction • Normalization of retention time • Selection of highly confident peptide hits from LCQ data Xcorr (+1) > 2.3; (+2) > 3.0; (+4) > 3.5 Total 206 I.D. • Search against FT ICR data with calculated monoisotopic masses Mass error < 0.05 Da • Data representation and visual inspection to remove spurious hits Deletion of the obvious outliers • Linear regression: RTLCQ = 0.9669*RTFT - 11.5872 correlation coefficient = 0.94 • Correlation and Integration • Sample preparation and protein digestion • The protein sample is denatured with 6-8 M Guanidine or Urea, and reduced with DTT or some other reducing agent at 60oC for 10-60 minutes. • The denaturant concentration is lowered by dilution with Tris; sequencing grade trypsin is added to the sample and incubated overnight • The sample is desalted by solid phase extraction and organic solvent is removed by SpeedVac • 1D LC / QIT MS2 • One-dimensional LC-MS/MS experiments were performed with an Ultimate HPLC (LC Packings, a division of Dionex, San Francisco, CA) coupled to an LCQ-DECA ion trap mass spectrometer (Thermo Finnigan, San Jose, CA) equipped with an electrospray source. Injections were made with a Famos (LC Packings) autosampler onto a 50ul loop. Flow rate was ~4ul/min with a 240min gradient for each run. • A VYDAC 218MS5.325 (Grace-Vydac, Hesperia, CA) C18 column (300µm id x 15cm, 300Å with 5µm particles) or a VYDAC 238EV5.325 monomeric C18 (300µm id x 15cm, 300Å with 5µm particles) was directly connected to the Finnigan electrospray source with 100µm id fused silica. • For all 1D LC/MS/MS data acquisition, the LCQ was operated in the data dependent mode with dynamic exclusion enabled, where the top four peaks in every full MS scan were subjected to MS/MS analysis. • SEQUEST and DTASelect • The resultant MS/MS spectra from the sample were searched with SEQUEST against the six constituent protein sequence and all predicted ORFs from R. palustris. The ORFs from R. palustris serves as indication of false position rate. • The raw output files were filtered and sorted with DTASelect. The filter criteria include the minimal Xcorr, the validation flag for FT ICR data hits and the FTICR mass measurement error LC-FTICR MS Total Ion Chromatogram Standard protein mixture digest 60 min gradient LC LC-QIT-MS2 Total Ion Chromatogram Standard protein mixture digest 60 min gradient LC • SEQUEST program • Peptide identification thru database searching (8 protein sequences + 4800 distracting protein sequences from R. palustris) No trypsin cleavage specificity used. • DTASelect program • Filter and assemble peptides. Identification (Xcorr (+1) > 1.8, (+2) > 2.5, (+3) > 3.5) • Total 301 MS/MS SEQUEST I.D.s passed cutoff • Ionspec FTdoc program • Determine charge state • De-isotope cluster • Filter noise • Export monoisotopic masses, retention time and intensity to ACSII files • Total 5496 data points observed Cal. Monoisotopic mass Monoisotopic mass INTRODUCTION Retention time • Proteomics • Systematic analysis of protein complement in a given cell, tissue or organism for their identity, quantity and function. • Major challenges: proteome coverage, low abundance proteins, membrane proteins, post-translationally modified proteins, • General procedures: Gel-based or LC-based separation, MS-based characterization, informatics-based identification. • Current approaches to proteomics • MudPIT technology (1) • Biphasic column separation of tryptic digested proteome, integrating SCX resin and RP resin in one column • Introduction of eluent directly to QIT through ESI interface; data-dependent MS2 scan of eluding peptides • Identification of peptides by SEQUEST database searching (2) • Assemble of peptide identification to protein identification by DTAselect (3) • Switching LC technology (4) • Autosampler loading of tryptic digested proteome onto a trapping cartridge • 1D RP-LC separation or 2D switching SCX/RP LC separation • QIT data-dependent MS2 scan of eluding peptides, possible multiple mass range scan • SEQUEST/MASCOT database searching and protein identification Advantages: • HPLC separation of peptides are relatively unbiased. • MS2 scans are informative of peptide sequence Disadvantages: • The score from MS2 database searching algorithm is the only base for identification calls • The selection of cutoff is a compromise between identification specificity and sensitivity • Common cutoff for SEQUEST Xcorr (+1) > 1.8, (+2) > 2.5, (+3) > 3.5 • AMT technology (5) “An AMT tag is a peptide with a sufficiently distinctive mass and LC elution time to act as a biomarker for a given protein.” 1. Construction of potential mass tag (PMT) library 1.1 Capillary HPLC / QIT MS2 characterization of a given organism’s proteome under a variety of conditions 1.2 Establishment of PMT for a peptide using a very liberal cutoff ( SEQUEST Xcorr (+1, +2, +3)> 2.0) • Construction of accurate mass and time tag (AMT) library 2.1 Capillary HPLC / FTICR MS characterization of those proteome samples 2.2 Establishment of AMT for a peptide matched with its PMT’s retention time and calculated mass 3. Proteome examination by capillary HPLC / FTICR MS 3.1 Capillary HPLC / FTICR MS characterization of the proteome samples of interest 3.2 Identification of protein by searching AMT library with measured mass and retention time Advantages: • High throughput proteome examination once AMT library is constructed • High proteome coverage given a confident AMT library Disadvantages: • Large initial effort investment in constructing AMT library • Multiple dimensional separation not straight-forward • False positive protein identification due to insufficiently distinctive mass and LC elution time of an AMT tag CONCLUSIONS • Development of a robust nanoLC-FTICR-MS system • Stable electrospray and good sensitivity in highly aqueous solution • Low sample consumption (~ 1 ug of total peptide loaded) • Good mass accuracy, mass resolution, dynamic range, and reproducibility • Development of retention time normalization and peptide correlation • Use of linear regression to offset gradient start time and normalize gradient slope • High correlation coefficient in retention times between LC-FTICR-MS and LCQ • Demonstration of comparability of FTICR data and QIT data • Demonstration of enhanced peptide identification from simple protein mixture digest • FTICR data used as a validation method for SEQUEST identification • Improved specificity and sensitivity in peptide identification for simple protein mixtures; should be much more enhanced for proteomes • Improvements in the mass measurement accuracy of FTICR and retention time reproducibility of LC system should provide more narrow windows • Improvements in peptide identification scoring should provide a more rigorous method to integrate FTICR accurate mass measurements and QIT MS/MS measurements. LCQ RT FTICR RT • Peptide identification with lowered Xcorr cutoff. (Xcorr (+1) > 1.3, (+2) > 2.0, (+3) > 3.0) • Total 442 MS/MS SEQUEST I.D.s passed cutoff Monoisotopic mass Normalization of retention time of LC-FTICRMS to the same scale as LC-LCQMS2 Cal. Monoisotopic mass Correlation Integration REFERENCES Normalized retention time Retention time • Link AJ, Eng J, Schieltz DM, Carmack E, Mize GJ, Morris DR, Garvik BM, Yates JR 3rdNat Biotechnol.199917, 676-82. • Eng JK, McCormack AL, Yates JR 3rd, J. Am. Soc. Mass Spectrom.199567, 1426-1436 • Tabb DL, McDonald WH, Yates JR 3rd, J Proteome Res.20021, 21-6. • VerBerkmoes NC, Bundy JL, Hauser L, Asano KG, Razumovskaya J, Larimer F, Hettich RL, Stephenson JL Jr. J Proteome Res.2002 1, 239-52. • Smith RD, Anderson GA, Lipton MS, Masselon C, Pasa-Tolic L, Shen Y, Udseth HR. OMICS.2002 6, 61-90 Acknowledgement : • Dr. David Tabb and Dr. Hayes McDonald are acknowledged for technical input and discussions. • C.P. and N.V. thank Genome Sciences and Technology graduate program for financial support. • Research was sponsored by the U.S. Department of Energy, Office of Biological and Environmental Research. Oak Ridge National Laboratory is operated and managed by the University of Tennessee-Battelle, LLC. for the U.S. Department of Energy under contract DE-AC05-00OR22725 Mass tolerance < 0.05 Da RT tolerance < 3 min Xcorr (+1) > 1.3, (+2) > 2.0, (+3) > 3.0) Export of results to DTASelect readable format. Use of manual validation flag to flag the presence of FTICR data hits Automatic 3 repetitive sample injections Highly reproducible results (mass spectra) A robust LC/MS system “Y”, if there is an FTICR hit within the mass and RT tolerance