Proteomics
Harini Chandra Affiliations. Proteomics.


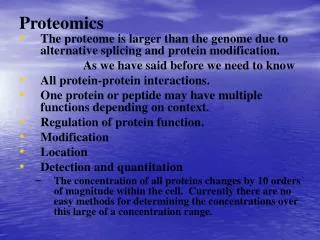
Proteomics
E N D
Presentation Transcript
Harini Chandra Affiliations Proteomics Despite the success of the genome sequencing project, researchers have come to realize that a better understanding of complex biological processes can be obtained through products of gene expression – the proteins. Proteomics, a study of the entire complement of proteins expressed by a cell, has emerged as an important platform to gain insights into cellular functions and processes.
Master Layout (Part 1) This animation consists of 5 parts: Part 1 – Genomics Vs Proteomics Part 2 – Gel-based proteomics Part 3 – Protein microarrays Part 4 – Mass spectrometry (MS) Part 5 – Detection techniques, an overview 1 Large amounts of intervening sequences Intron Transcription Pre-mRNA 2 Exon 1 Intron Intron Intron Exon 2 Exon 3 Exon 4 Exon 1 Exon 2 5’ 3’ Transcription Alternative splicing - Single gene, multiple protein products 3 P P P P P Transcription, translation & post-translational modification Post-translational modifications of proteins 4 Modified protein Genomic DNA 5 Source: Biochemistry by Stryer et al., 5th edition (ebook); Biochemistry by A.L.Lehninger et al., 3rd edition (ebook)
Definitions of the components:Part 1 – Genomics Vs proteomics 1 1. Genome: The entire sequence of an organism’s hereditary information, including both coding and non-coding regions, encoded in DNA is known as the genome. 2. Transcriptome: The set of all RNA molecules, including mRNA, rRNA and tRNA, present in an organism is referred to as the transcriptome. 3. Proteome: The entire complement of proteins expressed by the genome of an organism under specific defined conditions is known as the proteome. Like the transcriptome, the proteome of an organism will also vary with external factors and conditions. 4. Genomic DNA: The deoxyribonucleic acid polymeric sequence that acts as the store for genetic information and that is essential for the synthesis of RNA and protein molecules, which in turn are necessary for cellular functioning in all organisms. 5. Transcription: The process by which the genomic DNA is converted into a chemically related molecule, the messenger RNA or mRNA. Several enzymes and other factors are involved in this process and all regions of the DNA, coding and non-coding, get transcribed into the corresponding mRNA. 6. Pre-mRNA: The mRNA transcript that is produced from DNA as soon as transcription ends is known as the pre-mRNA. This contains both coding and non-coding sequences, is short lived and is further processed before translation. 7. Exon: The regions of the mRNA that code for specific portions or entire protein products upon translation are known as exons. They are often discontinuous with intervening nucleic acid sequences being present between them. 8. Intron: The intragenic sequences, sometimes considered as “junk” in the pre-mRNA that do not get translated into proteins are known as introns. These are removed during the process of RNA splicing. 2 3 4 5
Definitions of the components:Part 1 – Genomics Vs proteomics 1 9. Spliceosome assembly: This is made up of several protein-RNA complexes that bind the pre-mRNA and carry out splicing of the introns to give the mature mRNA. They are also commonly known as “snRNPs” or small nuclear ribonucleoproteins. These recognise specific sequences within the intron where they bind. 10. Mature mRNA: The mRNA that consists of only those nucleic acid sequences that are translated into proteins is known as the mature mRNA. 11.Alternative splicing: This is a process by which the exons or coding sequences of the pre-mRNA produced by transcription of a gene are combined in different ways during RNA splicing. The resulting mature mRNA give rise to different protein products by translation, most of which are isoforms of one another. In this way a single gene can give rise to multiple protein products. 12. Translation: This process reads the mRNA sequence in the form of three letter codes known as codons to incorporate the corresponding amino acids in the growing polypeptide chain. rRNA, tRNA and several enzymes are also required for successful translation of the mRNA into its corresponding protein. 13. Post-translational modification (PTM): Many proteins undergo modifications at some of their amino acid residues after the entire synthesis process. Hydroxylation, methylation, alkylation, acylation etc. are some of the most common modifications observed. These are essential for normal protein functionality. 14. Modified protein: The protein that has undergone the required PTMs and is ready to function is the modified protein in its native, stable state conformation. 2 3 4 5
Part 1, Step 1: 1 Spliceosome assembly Transcription Pre-mRNA 2 Exon 1 Exon 2 5’ Intron 3’ Mature mRNA 3 Exon 1 Exon 2 Unlike genomic DNA, proteins do not contain intervening sequences and are directly indicative of cellular function. 5’ 3’ Genomic DNA 4 Action Description of the action Audio Narration The colored circles must move across the dark blue region and then be removed. (Please redraw all figures.) First show the picture on the left followed by the arrow and appearance of the tricolor rod on top. Then show the colored circles appearing and their movement across the dark blue region as shown. This dark blue region along with the colored circles must then be removed and the red and light blue parts must join together. Genomic DNA consisting of introns and exons gets transcribed as such into its pre-mRNA. Specific recognition sequences within the intron employ the spliceosome assembly to it, which cleaves the intron out of the pre-mRNA. The resulting sequence consisting of only the coding exons is known as the mature mRNA and is ready for translation into the corresponding protein. 5 Source: Biochemistry by Stryer et al., 5th edition (ebook)
Part 1, Step 2: 1 Genomic DNA Exon 1 Intron Intron Intron Exon 2 Exon 3 Exon 4 Transcription 2 Pre-mRNA Spliceosome assembly Alternative splicing Exon 1 Exon 3 Exon 4 Exon 2 Exon 4 Exon 1 3 Mature mRNA-A Mature mRNA-B Translation Translation Single gene, multiple protein products indicates complexity of the proteome Protein B Protein A 4 Action Description of the action Audio Narration (Please redraw all figures.) First show the picture on top followed by the colored rectangular ‘pre-mRNA’ . Next show the colored figures which must move across the entire rectangular region acting like a pair of scissors. It must remove the yellow regions & in one case, the red, blue & green must rejoin while in the other, the red, violet & green must rejoin. These must then be shown to give the blue & pink ‘proteins. The colored rod must appear followed by movement of the grey object across it. Pre-mRNA transcribed from genomic DNA is often made up of several coding exons interspersed by non-coding introns. Alternative splicing, a common phenomenon observed in eukaryotes, allows the exons to be reconnected in multiple ways by several different mechanisms. The diversity of proteins encoded by a genome is greatly increased due to alternative splicing. Each mature mRNA formed gives rise to different protein products upon translation. 5 Source: Biochemistry by Stryer et al., 5th edition (ebook)
Part 1, Step 3: 1 The final functional protein structure most often does not correlate directly with the genome sequence due to several PTMs made in the protein. This further increases complexity of the proteome. Post-translational modifications 2 Protein Hydroxylation Phosphorylation Methylation Glycosylation 3 CH3 CH3 CH3 CH3 CH3 OH OH OH OH Glucose Glucose Glucose Glucose P P P P P Modified proteins 4 Action Description of the action Audio Narration The protein obtained by translation undergoes folding and various PTMs such as phosphorylation, alkylation, glycosylation, hydroxylation etc. to give the final functional protein. This adds to the complexity of each protein since the functional protein product does not directly correspond to its gene sequence. (Please redraw all figures.) First show the blue chain on top. Then show the various groups shown in the figures below being added to the blue chain and appearance of the images below as shown followed by the text box above. The blue chain on top must be shown to which the groups shown in figures below must be added. 5
Master Layout (Part 2) This animation consists of 5 parts: Part 1 – Genomics Vs Proteomics Part 2 – Gel-based proteomics Part 3 – Protein microarrays Part 4 – Mass spectrometry (MS) Part 5 – Detection techniques, an overview 1 IPG strip Cyanine-labeled proteins 2 Gel-based proteomic techniques Buffer Decreasing molecular weight SDS-PAGE gel Increasing pI 3 Polyacrylamide gel with SDS DIFFERENCE GEL ELECTROPHORESIS (DIGE) 2-D ELECTROPHORESIS (2-DE) Anode Buffer reservoir 4 SDS-PAGE 5 Source: Biochemistry by A.L.Lehninger et al., 3rd edition (ebook)
Definitions of the components:Part 2 – Gel-based proteomics 1 1. SDS-PAGE: A protein separation technique based on gel electrophoresis that is carried out under denaturing conditions. Separation in SDS-PAGE occurs almost exclusively on the basis of molecular weight since all proteins have a similar charge-to-mass ratio and shape after they have bound SDS. 2. 2-D Electrophoresis (2-DE): 2-DE is a powerful electrophoresis separation technique that separates proteins in two directions. Isoelectric focusing is carried out in the first dimension which separates proteins on the basis of their unique isoelectric points. This is followed by SDS-PAGE which separates proteins on the basis of their molecular weights. 3. Difference gel electrophoresis (DIGE): An extremely useful technique that allows more than one protein sample to be run simultaneously on a single 2-DE gel by carrying out differential labelling of each sample. This helps in eliminating any gel-to-gel variations and also simplifies the process of analyzing large number of samples. An internal standard consisting of equal amounts of all samples being run in the experiment is also run thereby further reducing any variations. 4. Polyacrylamide gel: The gel for SDS-PAGE consists of acrylamide, N,N’-methylenebisacrylamide and SDS in a suitable buffer. The molecular dimensions of the pores can be controlled by varying the amount of N,N’-methylenebisacrylamide with ammonium persulphate (APS) and tetramethylethylenediamine (TEMED) facilitating free radical generation and cross-link formations. Separation in SDS-PAGE occurs almost exclusively on the basis of molecular weight since all proteins have a similar charge-to-mass ratio and shape after they have bound SDS. This technique often allows separation of multi-subunit proteins into their individual components. 2 3 4 5
Definitions of the components:Part 2 – Gel-based proteomics 1 5. Well: These are small indentations made in the gel into which the sample is loaded. Usually, several samples can be run in parallel lanes simultaneously. 6. Buffer:A solution that can resist any changes in pH is known as a buffer. For electrophoresis, a buffer solution that can maintain the protein molecules with a net negative charge is placed in both upper and lower reservoirs of the electrophoresis unit. The negative charge ensures that all molecules migrate in one direction towards the anode in the lower reservoir. 7. Cathode and Anode: The oppositely charged electrodes to which current is applied. The negatively charged protein molecules migrate towards the positive anode. 8. IPG strip: Commercially available immobilized pH gradient (IPG) gel strips have replaced tube gels and have considerably facilitated the process of isoelectric focusing by eliminating the tedious steps of gel preparation and pH gradient establishment using ampholyte solutions. These strips, available across the pH range, contain a preformed pH gradient immobilized on a precast polyacrylamide gel placed on a plastic support. Narrow pH ranges can be selected for fine separations while broader pH ranges are also available for crude separations. These strips only need to be rehydrated with a suitable buffer before use. 9. Cyanine labelled proteins: Cyanine dyes (Cy3, Cy5 and Cy2) are derivatives of N-hydroxy succinimide that covalently bind the e-amino groups of a protein’s lysine residues and are spectrally resolvable as they fluoresce at distinct wavelengths. The labelled samples can therefore be mixed and run on a single gel, thereby eliminating the problem of gel-to-gel variations. 2 3 4 5
Part 2, Step 1: 1 Gel-based proteomic techniques 2 2-D ELECTROPHORESIS (2-DE) DIFFERENCE GEL ELECTROPHORESIS (DIGE) SDS-PAGE 3 Decreasing molecular weight Decreasing pI 4 Action Description of the action Audio Narration The three options must appear after the main heading on top and the ‘2-DE’ and ‘DIGE’ must be highlighted. (Please redraw all figures.) First show the main heading on top followed by the arrows appearing one at a time with the headings below along with the figures being shown as depicted in animation. User should be allowed to read definition of any of the three techniques by clicking on it. The ‘2-DE’ and ‘DIGE’ must finally be highlighted as shown. (Definitions of each technique as given in previous two slides). Gel-based proteomic techniques have been improved significantly to cater to the need of analyzing large number of protein samples simultaneously. 5 Source: Biochemistry by A.L.Lehninger et al., 3rd edition (ebook)
Part 2, Step 2: 1 2-DE, Isoelectric focusing Strip rehydration, 10-20 h 2 3 Buffer solution with protein sample Mineral oil Addition of mineral oil to avoid evaporation IPG strip Action Description of the action Audio Narration 4 Prior to isoelectric focusing in 2-DE, the commercially available IPG strips must be rehydrated. This is done by soaking them for 10-20 hours in the protein sample which is contained in a suitable buffer solution. Once the strips are rehydrated, they are covered with mineral oil to prevent evaporation of solution and drying of the gel. (Please redraw all figures.) First show the blue solution in the tray followed by the strip being placed in it. Next show the strip being removed and placed in the gray lane of the indented rectangle. Next the tube must appear and the orange liquid must be added across the strip as shown. As shown in animation. 5
Part 2, Step 3: 1 2-D ELECTROPHORESIS (2-DE) – Isoelectric focusing Active sample loading 2 Sample cups Increasing pH pH 3 3 IPG strip Cover fluid (to prevent drying of gel) Protein sample pH 9 IPG strip tray Action Description of the action Audio Narration 4 Once the IPG strips have been rehydrated, the strip is placed in the tray and the sample is added through the sample cup followed by the cover fluid to prevent drying of gel. In passive loading, the gel strip is placed face down in the cover fluid containing the sample for 10-12 hours after which it is run in an electric field. (Please redraw all figures.) First show the grey indented rectangle. Next show the blue strip being place in one lane with the red arrow and labels. Next, the circles must appear with the labels. Next show the ‘sample’ tube on the right and the hand moving into the tube and then into the circle in the second lane as depicted. Next, the hand must move into the orange tube and add solution into the lane in the second circle. As shown in animation. 5
Part 2, Step 4: 1 2-DE, Isoelectric focusing Isoelectric focusing unit 2 Tracking dye 3 Progress of electrophoresis is followed by means of tracking dye. Proteins are separated along the pH gradient according to their respective pI. Direction of migration 4 Action Description of the action Audio Narration (Please redraw instrument) The instrument on top must appear followed by the dotted lines. The strip on the left must appear and the grey bands must be shown to move in the direction indicated until they come to rest at the positions shown in the right-most figure. These bands must then change colour to blue. The grey bands must be shown to move in the direction indicated. These loaded strips are then focused on an isoelectric focusing unit by passing current. The various proteins of the sample mixture migrate in the electric field and come to rest when the pH is equal to their pI i.e. they become neutral and are no longer affected by the electric field. Progress of electrophoresis is monitored by means of a tracking dye like bromophenol blue (BPB) which is a small molecule and therefore migrates ahead of all other proteins. 5
Part 2, Step 5: 1 2-D ELECTROPHORESIS (2-DE) – SDS-PAGE IPG strip Direction of migration 2nd equilibration - gel placed in iodoacetamide 1st equilibration – gel placed in DTT 2 3 SDS-polyacrylamide gel slab Gel electrophoresis unit The IPG strip is then placed on the SDS-polyacrylamide gel for separation in the second dimension. 4 Action Description of the action Audio Narration As shown in animation. The IPG strip is equilibrated in a reducing agent like DTT followed by an alkylating agent, iodoacetamide which prevents reformation of the reduced bonds. This strip containing the separated proteins is then placed on the SDS-polyacrylamide gel slab and subjected to SDS-PAGE by applying a direct current between 100-350V depending upon the size of the gel. Any proteins that may have been present as a single band on the IPG strip due to similar isoelectric points can now be separated on the basis of their molecular weight with smaller proteins migrating farthest.. (Please redraw all figures.) First show the strip in the light blue solution in the first vessel. Next this strip must be transferred to the dark blue solution in the next vessel. The strip must then be transferred into the slot in the slab on the right as depicted in the animation. Next show the instrument on right and the dotted lines zooming into the figure above. The small blue lines must migrate from the top in the direction indicated. 5 Source: Biochemistry by A.L.Lehninger et al., 3rd edition (ebook)
Part 2, Step 6: 1 DIFFERENCE GEL ELECTROPHORESIS (DIGE) IPG strip Direction of migration, increasing pH Cy3 2 Sample 1 Direction of migration Cy5 Sample 2 3 Cy2 Internal standard (Sample 1+2) 4 Action Description of the action Audio Narration Each protein sample as well as the internal standard is labeled with a differently fluorescing cyanine dye which allows all protein samples to be simultaneously run on a single gel. The labeled protein samples are mixed together and run on a single 2-DE gel with separation taking place on the basis of pI in one dimension and molecular weight in the second dimension. As shown in animation. (Please redraw all figures.) First show the ‘sample 1’ tube followed by the red dye which must mix with it to give the red tube. Then the ‘sample 2’ tube mixing with the blue dye and then ‘sample 3’ mixing with the green dye. These 3 colored tubes must then be mixed to give the violet tube. The micropipette must be dipped in the purple solution and the yellow tip must become purple. It must then move to the blue strip and a small purple layer must appear on top of the circle indicated. There must be formation of bands in the strip after which it must be placed in the groove of the blue slab on the right. The small lines must then migrate from the top in the direction indicated. 5 Source: Biochemistry by A.L.Lehninger et al., 3rd edition (ebook)
Part 2, Step 7: 1 DIFFERENCE GEL ELECTROPHORESIS (DIGE) DIGE Imager Cy2 excitation wavelength 2 Cy3 excitation wavelength Cy5 excitation wavelength 3 All proteins with Cy2 label Only Cy3 labeled proteins Only Cy5 labeled proteins 4 Action Description of the action Audio Narration As shown in animation. (Please redraw all figures.) The instrument on top right must then be shown followed by the appearance of the three beams with their respective blue figures and labels below. This gel can be viewed by illuminating it alternately with excitation wavelengths corresponding to the various Cy dyes. This technique minimizes gel-to-gel variations and allows a large number of samples to be run using fewer gels, thereby proving to be extremely useful for large-scale proteomic applications. 5
Part 2, Step 8: 1 Increasing pI Increasing pI pH 4 pH 7 pH 7 pH 4 2 Decreasing molecular weight Decreasing molecular weight Molecular weight markers 3 Superimposed DIGE image Spot analysis: MW and pI of protein Coomassie stained 2-DE image 4 Action Description of the action Audio Narration View of a sample 2-DE gel which has been stained with Coomassie blue. Each spot provides information about the MW and pI of the proteins. The image on the right depicts a superimposed DIGE gel depicting all protein spots of multiple samples. Information on molecular weight and pI of proteins can be obtained from these spots. Show images. Show images. 5
Master Layout (Part 3) This animation consists of 5 parts: Part 1 – Genomics Vs Proteomics Part 2 – Gel-based proteomics Part 3 – Protein microarrays Part 4 – Mass spectrometry (MS) Part 5 – Detection techniques, an overview 1 Cell-based protein microarrays Gene insert Protein expression 2 Gene of interest Heterologous host (e.g. E. coli) Protein purification Expression vector 3 Chromatography 4 Protein purity tested Functionalized array surface SDS-PAGE 5 Purified protein of interest
Definitions of the components:Part 3 – Protein microarrays 1 1. Protein microarrays: These are miniaturized arrays normally made of glass, polyacrylamide gel pads or microwells, onto which small quantities of many proteins are simultaneously immobilized and analyzed. Protein microarrays can be generated by either traditional cell-based methods or more recently developed cell-free methods. 2. Cell-based protein microarrays: Generation of protein microarrays by this method involves expression of the protein of interest in a suitable heterologous host system such as E. coli, purification of the protein followed by printing of this purified protein on to a suitably functionalized array surface. This is a relatively conventional protocol and involves many time-consuming , laborious steps before the final protein array is developed. It is also associated with problems of storage for long durations and maintenance of protein function on the array surface. 3. Expression vector: An expression vector or construct is used to introduce and express a particular gene of interest in a target cell. An efficient expression vector system must be capable of producing large quantities of the protein product. 4. Heterologous host: A system such as E. coli that will provide the required cellular machinery for transcription and translation of the gene of interest which is introduced by means of a suitable expression vector. 5. Gene of interest: The gene that codes for the desired target protein that needs to be printed on the surface of the microarray. 6. Gene insert: The gene sequence that is taken up by the plasmid vector for further expression is then referred to as an insert. 7. Protein expression: The host system carries out transcription and translation using its cellular machinery to express the protein of interest along with its own proteins as well. 2 3 4 5
Definitions of the components:Part 3 – Protein microarrays 1 8. Protein purification: Since the target protein is expressed along with other proteins native to the host system, it is essential to purify the desired protein prior to printing on to the array surface. For this reason, the gene of interest is often fused with a convenient tag sequence such as His6 that will facilitate the purification process. 9. Chromatography: A convenient purification technique that separates proteins based on properties such as size, net charge or specific affinity towards a particular molecule or ligand. Several advancements have been made in chromatographic techniques that allow for accurate protein separation. 10. 2-D electrophoresis: This is another protein separation technique which is more commonly used for finer protein separation. It is a combination of isoelectric focusing in the first direction and SDS-PAGE in the second direction, thereby bringing about protein separation based on their isoelectric points (net charge) as well as their molecular weights. 11. Purified protein of interest: Once the purification is complete, the desired protein of interest is obtained which can then be used for spotting onto the array surface. 12. Protein printing: The purified protein is printed onto the array surface using a robotic arm in ng or pg quantities and used for any further studies. 13. Functionalized array surface: The microarray surface must be suitably derivatized with a chemical reagent that can react with the groups present on the protein surface in order to firmly immobilize them on the microarray. Functionalization is often done with silane derivatives as these react easily with the groups present on the protein. Aldehyde groups react with amine groups present on the protein to form Schiff’s base linkages which hold the protein firmly in place. 2 3 4 5
Part 3, Step 1: 1 Cell-based protein microarrays – protein expression Gene insert Protein expression machinery 2 Gene of interest Heterologous host Expression vector 3 Transcription Translation mRNA Expressed proteins 4 Action Description of the action Audio Narration The green arc must be incorporated in the multicolor circle. The second figure must then be zoomed into and animation below shown. First show the figure on the top left with the multicolor circle. Next, show the green arc being incorporated as part of this circle followed by appearance of the colored circles and brown figures. This must be zoomed into and the animation sequence shown below must be shown. The gene coding for the protein of interest is expressed in a suitable heterologous host system such as E. coli by means of expression vectors like plasmids. The host cell machinery is used for transcription and translation which results in a mixture of proteins consisting of the target protein along with other host proteins. 5
Protein purification Part 3, Step 2: 1 His6 tagged protein Purified protein Protein of interest 2 Separation based on MW Ni-NTA coated beads Direction of migration 3 Chromatographic purification SDS-PAGE Protein of interest Unwanted proteins 4 Action Description of the action Audio Narration As shown in the animation. (Please redraw all figures.) First show the mixture in the can on top along with the first column. Then show the mixture in the can being poured into the column followed by appearance of the flask on top. The red and blue objects must then come out of the column into the tube below. Next the second column and tube must appear and from this the yellow and purple objects must come down into the tube below and the ‘unwanted proteins’ label must appear. Finally the third column and tube must appear and the green object must come into the tube. The figure on the right must be shown with the 3 tubes and the blue slab. The arrow marks with labels must appear followed by colored spots. The green spot and tube must then be highlighted as shown. Since the protein of interest is expressed along with other proteins native to the host, it is essential to purify the target protein before it can be used for microarray applications. This can be done by chromatographic procedures to obtain the pure target protein. Protein purity is tested on SDS-PAGE gels. Tags like His6 are often fused with the protein of interest to facilitate the purification process due to its specific affinity towards nickel. 5 Biochemistry by A.L. Lehninger, 3rd edition (ebook)
Part 3, Step 3: 1 Cell-based protein microarrays – array functionalization & printing Target protein NH2 NH2 NH2 NH2 NH2 Robotic arm Aldehyde functionalization Derivatized array surface 2 CHO CHO CHO CHO CHO CHO CHO CHO CHO CHO Si Si Si Si Si Si O O O O O O O O O O O O 3 Silane derivatization Protein microarray 4 Action Description of the action Audio Narration As shown in animation. The array surface is functionalized with a suitable chemical reagent that will react with groups present on the protein surface. Aldehyde and silane derivatizations are commonly used as they interact well with amino groups present on the protein surface resulting in firm capture of the protein. The protein solution is printed on to the array surface in extremely small volumes by means of a robotic printing device that has small pins attached to it for this purpose. The slides are incubated for a suitable duration following the printing step to allow capture of the protein on to the array surface. The unreacted sites are then quenched by means of BSA which also prevents any non-specific protein binding in subsequent steps. (Please redraw all figures.) First show the parallelogram with spots. Then show the hand moving from left to right along the spots followed by appearance of the red cloud and disappearance of the hand. The spots are then zoomed into and the structures above must be shown. Next show the picture with the black robotic arm moving across the translucent surface from bottom to top. Then zoom into the translucent surface to show the figure on the right. 5
Part 3, Step 4: 1 Cell-based protein microarrays – types of arrays Reverse phase arrays Forward phase (capture) arrays Probe antibody Test lysate 2 Specific antigen binding Capture antibody immobilized Direct labeling 3 4 Action Description of the action Audio Narration There are two types of protein arrays that are commonly used. In forward phase or capture arrays, the analyte of interest such as an antibody or aptamer is bound to the array surface and then probed by the test lysate which may contain the antigen of interest. In reverse phase arrays, however, the test cellular lysate is immobilized on the array surface and then probed using detection antibodies specific to the target of interest. First show the parallelogram below followed by zooming into the dots. Then show the figure on left top with the blue circles binding to the V shaped objects below. Similarly, then show the figure on right with the V shaped objects moving down and binding to the blue circles. The dots must be zoomed into and the two figures above muse be shown as in the animation. 5
Master Layout (Part 4) This animation consists of 5 parts: Part 1 – Genomics Vs Proteomics Part 2 – Gel-based proteomics Part 3 – Protein microarrays Part 4 – Mass spectrometry (MS) Part 5 – Detection techniques, an overview 1 2 Sample inlet Charged peptide fragments + + + + + + + + + 3 Mass analyzer Intact protein to be analyzed Detector Ionization source 4 Mass spectrometer 5
Definitions of the components:Part 4 – Mass spectrometry 1 1. Mass spectrometer:An instrument that produces charged molecular species in vacuum, separates them by means of electric and magnetic fields and measures the mass-to-charge ratios and relative abundances of the ions thus produced. 2. Protein sample: The protein whose sequence is to be analyzed must be broken down into peptide fragments, analyzed by mass spectrometry and the sequences then re-assembled so that the intact protein sequence is obtained. 3. Sample inlet: The first point of contact where the sample is introduced within the mass spectrometer either as liquid nano-droplets or alongside small matrix molecules. 4. Ionization source: This unit is responsible for converting analyte molecules into gas phase ions in vacuum. The technology that enables this is termed soft ionization for its ability to ionize non-volatile biomolecules while ensuring minimal fragmentation and thus, easier interpretation. The most common ionization sources employed are Matrix Assisted Laser Desorption-Ionization (MALDI) and Electrospray Ionization (ESI). 5. Mass analyzer: The mass analyzer resolves the ions produced by the ionization source on the basis of their mass-to-charge ratios. Various characteristics such as resolving power, accuracy, mass range and speed determine the efficiency of these analyzers. Commonly used mass analyzer include Time of Flight (TOF), Quadrupole (Q) and ion trap. 6. Charged peptide fragments: The peptide fragments generated by the ionization source carry positive, negative as well as neutral charges. Sensitivity of detection for positive ions is higher than negative ions while neutral ions cannot be detected by MS. 7. Detector: The ion detector determines the mass of ions that are resolved by the mass analyzer and generates data which is then analyzed. The electron multiplier is the most commonly used detection technique. 2 3 4 5
Part 4, Step 1: 1 Ionization source – Matrix Assisted Laser Desorption Ionization (MALDI) LASER source Analyte embedded in matrix 2 Towards mass analyzer 3 Peptide ions Matrix Protein sample 4 Description of the action Audio Narration Action In MALDI, one of the most commonly used soft ionization techniques, the analyte of interest is mixed with an aromatic matrix compound like a-cyano-4-hydroxycinnamic acid, sinapinic acid etc. This is then dissolved in an organic solvent and placed on a metallic sample plate. The evaporation of solvent leaves the analyte embedded in the matrix. The target plate is placed in a vacuum chamber with high voltage and short laser pulses are applied. The laser energy gets absorbed by the matrix and is transferred to the analyte molecules which undergo rapid sublimation resulting in gas phase ions. These ions then accelerate towards the mass analyzer based on their mass-to-charge ratio. As shown in animation. First show the blue rectangle on the left with orange ovals in it. This must be zoomed into to show the figure below in the circle. Next, show the ‘laser source’ on top right which must emit light onto the blue rectangle. When this happens, the orange ovals must break into smaller circles of different sizes and move away from the rectangle. The smallest circles must be farthest in front and vice versa. Some small blue fragments must also be shown to move out from the blue rectangle. 5
Part 4, Step 2: 1 Ionization source – Electrospray Ionization (ESI) Ion current Protein/peptide sample 2 c + + + + + + + + + + + + v + 3 Capillary tip Spray needle Sample orifice ~2.2 kV 4 Action Description of the action Audio Narration As shown in the animation. In ESI, the sample is present in the liquid form and ions are created by spraying a dilute solution of the analyte at atmospheric pressure from the tip of a fine metal capillary, creating a mist of droplets. The droplets are formed in a very high electric field and become highly charged. As the solvent evaporates, the peptide and protein molecules in the droplet pick up one or more protons from the solvent to form charged ions. These ions are then accelerated towards the mass analyzer depending upon their mass and charge. First show the tube on the left along with the blue box which is connected to a supply as shown. As well as the red ‘M’ shaped structure on the other end. Next show a liquid entering the leftmost end of the tube which must move along the entire length of the tube and once it reaches tip, show a spray of small dots/circles coming out of the tip which must move towards the gap in the middle of the ‘M’ shape with smallest ones passing through the small gap first. 5
Part 4, Step 3: 1 Time of flight (TOF) Quadrupole(Q) Magnetic sector 2 Mass analyzers 3 Ion trap Orbitrap Ion cyclotron resonance (ICR) 4 Action Description of the action Audio Narration As shown in animation. The mass analyzer resolves the ions produced by the ionization source on the basis of their mass-to-charge ratios. Various characteristics such as resolving power, accuracy, mass range and speed determine the efficiency of these analyzers. Commonly used mass analyzer include Time of Flight (TOF), Quadrupole (Q) and ion trap. Here, we will focus on TOF and quadrupole mass analyzers. First show the central heading in the oval followed by each of the arrows and their respective headings. Once all heading are shown, only the green and red ones must be highlighted as shown in the animation. 5
Part 4, Step 4: 1 Mass analyzer – Time of flight (TOF) Relative abundance Laser source m/z 2 Detector + + + + + + + 3 + + + + + + TOF tube Sample plate Reflector 4 Action Description of the action Audio Narration As shown in animation. The time of flight analyzer accelerates charged ions generated by the ionization source along a long tube known as the flight tube. Ions are accelerated at different velocities depending on their mass to charge ratios. Ions of lower masses are accelerated to higher velocities and reach the detector first. The TOF analyzer is most commonly used with MALDI ionization source since MALDI tends to produce singly charge peptide ions. The time of flight under such circumstances is inversely proportional to square root of molecular mass of the ion. First show the blue tube with all its components and their labels. Next show a light coming out of the red cylinder which must hit the white plate on the left and then move towards the white ‘reflector’ on the right end of the tube and finally must be deflected onto the detector. Next show the ions of different sizes appearing which must move at different speeds across the tube with the smallest ones moving the fastest and largest moving slowly. They must move until they reach the detector after which the graph above must be shown. 5
m1 m2 m4 m3 Part 4, Step 5: 1 Quadrupole (Q) mass analyzer RF (radio frequency) mode: Allows ions of any m/z ratio to pass through Detector 2 - - - 3 - Ion source - - 4 Action Description of the action Audio Narration First show the four parallel rods, the ‘ion source’ and ‘detector’. Show the colored circles coming out of the ion source and all of them moving towards the detector with slightly different speeds. Quadrupole mass analyzers use oscillating electrical fields to selectively stabilize or destabilize the paths of ions passing through a radio frequency (RF) quadrupole field. The quadrupole mass analyzer can be operated in either the radio frequency or scanning mode. In the RF mode, ions of all m/z are allowed to pass through which are then detected by the detector. Movement of colored circles. As shown in the animation. 5
m1 m2 m4 m3 Part 4, Step 6: 1 Quadrupole (Q) mass analyzer Scanning mode: Ions of selected m/z ratio are allowed through to the detector Detector 2 - - - 3 - Ion source - - 4 Action Description of the action Audio Narration First show the four parallel rods, the ‘ion source’ and ‘detector’. Show the colored circles coming out of the ion source and only the blue circle moving towards the detector . In the scanning mode, the quadrupole analyzer selects ions of a specific m/z value as set by the user. A range can also be entered in which case only those specific ions satisfying the criteria will move towards the detector and the rest are filtered out. Movement of the colored circle. As shown in the animation. 5
Part 4, Step 7: 1 Typical MS configurations TOF MALDI 2 TOF Q ESI Ion trap ESI 3 Ion trap MALDI 4 Action Description of the action Audio Narration Show each of the pairs appearing and joining together as shown in the animation. As shown in animation. Some of the most commonly used MS configurations are MALDi with TOF or Ion trap and ESI with Q, TOF and Ion Trap. Two mass analyzers can also be connected in series such that the first one separates intact ions while the second one separates the fragmented ion particles. This helps in providing better resolution and allows identification of proteins through peptide fingerprinting. Hybrid TOF analyzers such as Q-TOF make it possible to carry out high throughput analysis. 5
Master Layout (Part 5) This animation consists of 5 parts: Part 1 – Genomics Vs Proteomics Part 2 – Gel-based proteomics Part 3 – Protein microarrays Part 4 – Mass spectrometry (MS) Part 5 – Detection techniques, an overview 1 Organic stains 2 Gel-based detection techniques Fluorescent dyes Detection techniques 3 Label-based 4 Label-free Microarray-based techniques 5
Definitions of the components:Part 5 – Detection techniques, an overview 1 1. Detection techniques: Proteomics research requires detection of extremely small quantities of proteins either on gels or on microarrays. This requires development of techniques that are extremely sensitive and specific towards the protein of interest. Rapid advancements have been made in this regard with detection systems being able to detect even pg quantities of proteins in high throughput. 2. Gel-based methods: Detection of proteins that have been separated by the various gel electrophoresis methods requires that the gel be stained with suitable dye solutions for viewing. Detection using organic and fluorescent dyes for gel-based proteomics have developed significantly over the last few years allowing researchers to detect even minute quantities of proteins. 3. Microarray-based techniques: Detection for protein microarrays require that the technology be capable of detecting several thousands of proteins simultaneously and with very high sensitivity. The protein activity and function must not be hampered in the process of detection. 4. Organic stains: Most commonly used staining agents for gel-based proteomics include Coomassie Brilliant Blue (CBB) and silver stain. These are convenient and simple to use and offer high sensitivity down to 1 ng level. The proteins are first fixed in the gel using a suitable fixing solution, then soaked in the dye solution and finally destained to remove any excess dye bound to the gel. These gels can be viewed as such and their images scanned using a suitable scanning device. 2 3 4 5
Definitions of the components:Part 5 – Detection techniques, an overview 1 5. Fluorescent dyes: The phenomenon by which a substance absorbs radiation of one wavelength and emits radiation of another, usually longer, wavelength is known as fluorescence. The energy difference between the absorbed and emitted radiations is used for electronic transitions within the molecule. Based on this principle, several fluorescent dyes have been developed that are capable of sensitive detection of proteins over a wider linear dynamic range as compared to organic stains. These include SYPRO dyes, cyanine dyes and certain dyes that are capable of detecting specific modified proteins like Pro-Q diamond. 6. Label-based:With rapid advancements in gel-free proteomics, particularly protein microarrays, the need for improved detection systems has been imperative. Label-based detection techniques have taken rapid strides to satisfy this demand with significant improvements in sensitivity, multiplexing capability and reproducibility. Commonly used techniques make use of chromogenic, fluorescence-based, radioactive or chemiluminescence-based detection, each with its own unique principle. 7. Label-free: Drawbacks associated with label-based technologies has been major motivation for development of reliable, sensitive and high-throughput label-free detection techniques for proteomic studies. Label-free detection methods, which monitor inherent properties of the query molecule itself such as refractive index, angle of reflection, dielectric property etc promise to simplify bioassays through elimination of secondary reagents. 2 3 4 5
Part 5, Step 1: 1 Organic stains Gel-based detection techniques 2 Fluorescent dyes Detection techniques Label-based 3 Label-free 4 Action Description of the action Audio Narration As shown in animation. Each technique must be shown to appear sequentially as depicted. At the end of it, the orange ‘organic stains’ and purple ‘label-based’ boxes must be highlighted. User should be allowed to click on any of the boxes to read the explanations as given in previous two slides. <As described in previous two slides.> Microarray-based techniques 5
Part 5, Step 2: 1 Organic stains: Coomassie Brilliant Blue (CBB) Forms ionic & non-covalent interactions with proteins Completed electrophoresis gel 2 3 Tray Mechanical rocker Coomassie blue solution 4 Action Description of the action Audio Narration The completed electrophoresis gel is placed in a tray containing the Coomassie blue staining solution, typically R-250, that has been dissolved in an aqueous solution of ethanol and acetic acid. Negatively charged Coomassie dye interacts with proteins through ionic and non-covalent interactions. This tray is then placed on a mechanical rocker that allows for uniform contact of the gel with the solution by means of gentle rocking. (Please redraw chemical structure and mechanical rocker) First show the tray on the left followed by a blue solution being filled in it. Next show the ‘completed gel’ being placed in this solution. Then show the instrument on the right and the tray with gel being placed on it. This must then be shown to rock from side to side as indicated by the arrow. Show the tray on the left followed by a blue solution in it and placement of the ‘gel’ in the solution. 5
Part 5, Step 3: 1 Organic stains: Coomassie Brilliant Blue (CBB) Stained gel 2 3 Excess stain removed A 2-D gel image showing final gel pattern with stained protein bands Tray Destaining solution 4 Action Description of the action Audio Narration Show the ‘gel’ being removed from the blue solution and being placed in a transparent solution as shown above. First show the gel being removed from the blue solution in the previous slide and being placed in a colorless solution, as shown above. This must again be placed on the ‘mechanical rocker’ shown above and as the rocking takes place, the colorless solution must slowly turn blue. The stained gel is then placed in a destaining solution consisting of 50% methanol & 10% acetic acidto remove any excess dye that may be bound to the gel. The gel is finally removed and viewed by means of a scanner where the blue protein bands can be easily detected. 5
Part 5, Step 4: 1 Organic stains: Silver staining Completed electrophoresis gel 2 3 Ag+ Ag+ Ag+ Ag+ Ag+ Tray Mechanical rocker Fixing solution (acid/alcohol) – to minimize diffusion of protein bands in gel Silver stain 4 Action Description of the action Audio Narration Show the tray on the left followed by first a pale grey solution and then a pale orange solution in it. The completed gel is first placed in a fixing solution of methanol and acetic acid that fixes the protein bands in the gel and minimizes any diffusion. This must be subjected to gentle shaking for around 30 minutes after which the silver stain solution is added. The gels are rocked gently in order to allow for proper and uniform staining. First show the tray on the left followed by a pale grey solution being filled in it and the label ‘fixing solution’. Next show the ‘completed gel’ being placed in this solution. After a while, show the grey solution being removed and being filled by a pale orange solution, ‘silver stain’. When this is done, the grey circles must appear in solution. Then show the instrument on the right and the tray with gel being placed on it. This must then be shown to rock from side to side as indicated by the arrow. 5
Part 5, Step 5: 1 Organic stains: Silver staining Stained gel 2 OH- HCHO HCHO OH- Developing solution OH- 3 HCHO Ag+ Ag+ Ag+ Ag+ Ag+ Ag+ Final gel pattern with silverstained protein bands Ag+ + HCHO + OH- Ag+ + HCOO- + H2O 4 Action Description of the action Audio Narration The silver stained gels are first washed to remove any excess stain and then placed in a developing solution where the silver ions get reduced to metallic silver. Formaldehyde in an alkaline solution in presence of sodium carbonate or other alkaline buffers are commonly used for this process. This gel can then be viewed as dark bands against a light background as shown in the figure on the right. Show the ‘gel’ being removed from the orange solution and being placed in the pale pink solution. First show the gel being removed from the orange solution in the previous slide and then being placed in a pale pink solution containing green ovals and orange rectangles along with the grey circles, as shown above. This must again be placed on the ‘mechanical rocker’ shown in the previous slide and rocked gently. When this is taking place, the equation in the grey box must appear. Finally the image on the right must be shown. 5
Part 5, Step 6: 1 Label-based: Fluorescence-based detection Fluorescence intensity Target antigens Fluorophore -bound probe antibodies 2 Excitation wavelength Emission wavelength Time Ab coated array surface 3 Protein microarray 4 Action Description of the action Audio Narration First show the grey surface with spots which must be zoomed into to show the yellow surface coated with the Y shaped brown objects. Then show the violet circles which must move down and bind to the brown objects as shown. Next show the green inverted Y with their fluorescent green labels. These must then bind to the violet circles. This is followed by a light falling on the surface and emission of light of different color from the surface and appearance of the graph. The target antigens bound to their primary antibodies on the array surface are detected by means of fluorescent labeled secondary antibodies. Excess unbound secondary antibody is washed off and the fluorescence measured by exciting the array with light of suitable wavelength. The resulting emission is measured and can be used to quantify the corresponding antigen-antibody interaction. As shown in animation. 5
Interactivity option 1:Step No: 1 1 Certain well characterized proteins are printed on the array below with their corresponding query molecules shown on the left labeled with differently fluorescing dyes. Match the protein interacting pairs, Jun & Fos, p53 & MDM2, by dragging the query to the correct protein on the array surface in order to see the signal output. 2 p53 Jun 3 MDM2 Signal output Fos 4 Results Interacativity Type Options Boundary/limits Once the user matches the green shape to the orange dots, its color must change to blue and once the purple shape is matched with pink dots, its color must become red. Then the figure on the right must appear. User must drag and drop the figures given on the left to their corresponding coloured circles on the grey surface. Drag and drop. 5
Questionnaire 1 1. A pre-mRNA sample has 150 nucleotides with two introns and two exons. Both the introns are 30 nucleotides long. What will be the length of the final mature mRNA? Answers: a) 100 b) 85 c) 90 d) 150 2. The net charge of a protein when it comes to rest on an IEF gel is Answers: a) Positive b) Neutral c) Negative d) Doubly positive 3. Choose the odd-one out Answers: a) SYPRO-Ruby b) Cyanine dyes c) Pro-Q diamond d)Coomassie brilliant blue 4. Which of the following is not a mass analyzer? Answers: a) TOF b) ESI c) Quadrupoled) Ion trap 5. Which are the two types of ionization sources used for the Mass Spectrometric analysis of biological samples? Answers: a) Fast Atom Bombardment and Chemical Ionization b) Electron Transfer Dissociation and Collision Induced Dissociation c) Matrix Associated Laser Desorption Ionization and Electrospray Ionization d) Electron Transfer Dissociation and Matrix Associated Laser Desorption Ionization . 2 3 4 5
Links for further reading Books: Biochemistry by Stryer et al., 5th edition Biochemistry by A.L.Lehninger et al., 3rd edition Biochemistry by Voet & Voet, 3rd edition Research papers: • Pandey, A. & Mann, M. Proteomics to study genes and genomics. Nature 2000, 405, 837-846. • Zhu, H., Snyder, M., Protein arrays and microarrays. Curr.Opin. Chem. Biol. 2001, 5, 40–45. • MacBeath G: Protein microarrays and proteomics. Nat Genet 2002, 32(Suppl):526-532. • MacBeath, G., Schreiber, S. L., Printing proteins as microarrays for high-throughput function determination. Science 2000, 289, 1760–1763. • Brown, P. O., Botstein, D., Exploring the new world of the genome with DNA microarrays. Nat. Genet. 1999, 21, 33–37. • Unlu, M., Morgan, M. E., Minden, J. S. Difference gel electrophoresis: A single gel method for detecting changes in protein extracts. Electrophoresis 1997, 18, 2071-2077.
Links for further reading • Gorg, A. et al. The current state of two-dimensional electrophoresis with immobilized pH gradients. Electrophoresis 2000, 21, 1037-1053. • Patton, W. F. Detection technologies in proteome analysis. J. Chromatogr. B. 2002, 771, 3-31. • Mackintosh, J. A. et al. A fluorescent natural product for ultra sensitive detection of proteins in one-dimensional and two-dimensional gel electrophoresis. Proteomics 2003, 3, 2273-2288. • Aebersold, R., Mann, M., “Mass spectrometry-based proteomics.” Nature. 2003,422(6928),198-207. • Karas, M., Hillenkamp, F., (1988). "Laser desorption ionization of proteins with molecular masses exceeding 10,000 daltons". Anal. Chem. 1988, 60, 2299–2301.