Proteomics
Proteomics. James Mobley, Ph.D. Director, UAB Bioanalytical & MS Shared Facility Director, Urologic Research Assistant Professor, Surgery, Chemistry, Pharmacology, Preventative Medicine. What is Proteomics ? Studies with focus on proteins (not necessarily MS based)


Proteomics
E N D
Presentation Transcript
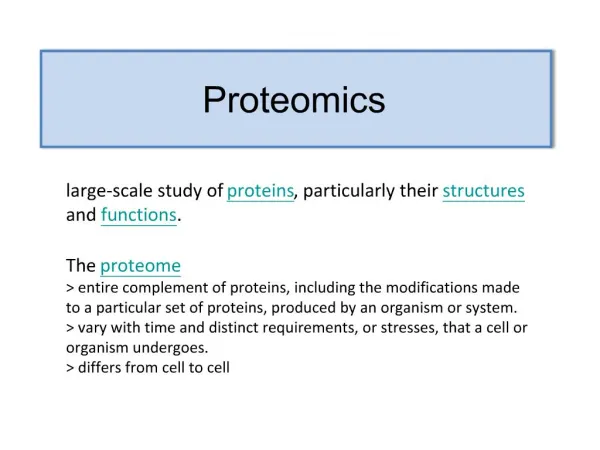
Proteomics James Mobley, Ph.D. Director, UAB Bioanalytical & MS Shared Facility Director, Urologic Research Assistant Professor, Surgery, Chemistry, Pharmacology, Preventative Medicine.
What is Proteomics? Studies with focus on proteins (not necessarily MS based) What tools do we have? How do we study specific proteins that are known, or even unknown? We generally want to obtain a measurement of an exact or relative change in the quantity of a protein (or protein modification) as they are effected by the introduction of a specific treatment or exposure. This may be to an isolated protein in a test tube, in a cell culture setting, or a live animal.
Experimental side of things….. • Before we go forward, what are we measuring when we study a compound in a specific setting: • Test tube (purified protein + compound = modification to that protein? what modification at what concentration?) • Cell culture (biological mechanism can be studied; direct change to protein, indirect changes i.e. receptor mediated, parent or daughter molecule) • Animal model (translatable; system wide multi-organ effects, and discovery of biological markers to mark those effects) • Also, what problems and advantages do we have in the way of proteomics studies when we go from one setting to the next? • We go from a purified known protein in high quantity to increasingly complex systems, with the ability to measure indirect system wide effects.
What Tools Encompass Proteomics • Relative or Absolute Quantification of Known Proteins……. • Mass Spectrometry (Mass Tags/ AQUA) • Immuno-Directed (examples) • 1) Protein Arrays, 2) Western Blot, 3) ELISA, 4) Bioplex/ Luminex • Characterization of Unknown Proteins/ Mapping Post Translational Modifications (PTM’s)…….. • Sequencing of Unknowns, Mass Spectrometry alone!
Comparative proteomics often from a clinical perspective….. • To find associations between biological components (i.e. SM, FA’s, Proteins) and any clinical endpoint quickly, non-invasively, affordably. • To non-invasively determine….. • Pathologic Changes (i.e. early detection of cancer) • Aggressiveness/ Stage of Disease • Predicting Rx Response • Drug Target Discovery • Mechanistic Studies (Systems Biology) • The Potential Clinical Impact is Tremendous!!
General Theme: Mass Spectrometry Driven Discovery & Directed Quantitative Proteomics (non-Tagged/ SILAC/ AQUA) IP (PTM or Protein Directed) (SILAC) 1D or 2D PAGE (SILAC/ AQUA) In-Solution Digest Systems Biology (i.e. Cytoscape) Cellular Location Molecular Process Biological Function HTP-MALDI-Tof/Tof (200 spots per night) Nano-LC-MS(MS)2-CID/ETD (~6000/spectra/hr) Characterization (Relative/ Absolute Quantification)
Discovery and Directed Based Proteomics/ Lipidomics Non-Tagged
Systems Biology Workflow DNA mRNA Protein Protein-Complex/ Enzymes Genomics Functional Genomics Proteomics Functional Proteomics Systems Biology • Biomarker Discovery • Better Understanding of Global Analysis • Informatics of Complex Data Sets Cells Tissues Organs Organism
Overview of Systems Biology Approaches Now you have a long list of “interesting proteins”…….. How do you sidestep the “So What” factor…….. Systems Biology! Great Overview at…….. http://www.cytoscape.org/ http://cytoscape.org/cgi-bin/moin.cgi/Presentations
Brain 119 Liver 75 57 Kidney 131 Lung 122 Example of Common Proteins *Acyl-CoA-binding protein Aldose reductase *Alpha-enolase *Apolipoprotein D precursor *ATP synthase-coupling factor Bisphosphoglycerate mutase *Copper transport protein ATOX1 *Cytochrome c oxidase *D-dopachrome decarboxylase Dynein light chain roadblock-type 1 *Glutathione S-transferase P 1 Isopentenyl-diphosphate isomerase 1 L-xylulose reductase *Peptidyl-prolyl cis-trans isomerase A *Phosphatidylethanolamine-binding protein 1 Polyadenylate-binding protein 1 Protein S100-A6 *Ptms protein *Selenium-binding protein 1 *Superoxide dismutase [Cu-Zn] Thioredoxin *Thymosin beta-4 *TSC22 domain family protein 1 *Albumin *Apolipoprotein A-II Calmodulin 1 *Caronic anydrases (2) *Hb-alpha *Hb-beta *Keratin Subtypes (10) *MIF Mitochondrial Membrane Tim8 A Mitochondrial Membrane Tim8 B *Niemann Pick type C2 *Prosaposins (3) Ubiquitin C, full insert sequence *Unknowns or Not Annotated (8) Example (Secreted): Total Unique Proteins = 277 Brain (B) 119 Liver (Li) 75 Lung (Lu) 122 Kidney (K) 131 Common (>2) 57 *Common (all 4) 33
Example (Mouse Model – Pancreatic Cancer): Protein bands were excised from the 1D gel for Ras and Ras:p53-63, digested with trypsin and run with LTQ-XL/CID mode. The results from LTQ-XL were run through SEQUEST to identify proteins. The proteins unique to Ras;p53-63 was run through *Cytoscape to see how those proteins relate to one another based on their molecular functions. Binding Ras Ras;p53 Red-ox Transporter 532 150 520 Transferase Ligase Protein modification Receptor *Cytoscape is an open source bioinformatics software platform for visualizing molecular interaction networks and integrating these interactions with gene expression profiles and other state data.
Non-Tagged Analysis of Pancreatic Juice (Cancer Vs. Non-Cancer) Protein images
Laser + + + + + + Laser Slice frozen tissue on cryostat (~12 m thick) Thaw slice onto MALDI plate, allow to dry Spray coating Droplets Apply matrix Acquire mass spectra Protein profiles Protein images m/z 18 388
Tissue Based Discovery Proteomics:Histology Guided Matrix Deposition (Profiling MS) Laser M3 M2 M1 Mass (m/z)
Results from Mass Profiling Tissue Sections M.G. - NO Tumor M.G. – Early BCa M.G. – Late BCa 2 kDa 20 kDa
1000 m Intensity 2014 15579 29144 42708 56273 69838 Mass (m/z) MS Imaging of a Mouse Brain Section m/z 17885 m/z 11839 m/z 20688 0 % 100 % m/z 11790 m/z 6759 m/z 7338
Focus Today: Tissue profiling ; LC/MS and directed MALDI Pharmaco-Proteomics (pristanic acid & AMACR) Identification of Markers from Gentamicin Induced Kidney Damage in Monkey…….
Project 1; Tissue Profiling; mining for markers of diagnosis & progression?
Protein markers indicative of disease will be identified through a series of separation approaches and validated by IHC. Present data is novel and adequate for preliminary data for a funding mechanism.
Protein Identified in this Study: Diagnostic - Cancer Specific Heat shock cognate 71 kDa protein, Prostate specific antigen, Alpha-2-HS-glycoprotein, IGHA2, Golgi phosphoprotein 2, APS protein, 60 kDa heat shock protein, RcTPM3, Macrophage migration inhibitory factor, Histone 1, Antithrombin-III, Peroxiredoxin-1, Alpha-enolase, Malate dehydrogenase, Fructose-bisphosphate aldolase, ATP synthase subunit alpha Prognostic - Grade Specific Malate dehydrogenase, Alpha-enolase, Tropomyosin, Filamin-A, Apolipoprotein A-I precursor (Apo-AI), Zinc-alpha-2-glycoprotein, Serotransferrin, prostate specific antigen, Lipoma-preferred partner, Prostatic acid phosphatase, APS protein, Vimentin, Calponin-1, Cytochrome c oxidase, Alpha-1-antichymotrypsin, Smooth muscle myosin, Beta-microseminoprotein, Elongation factor 1-alpha 1
Project 2;AMACR in Prostate Cancer AMACR is overexpressed in the epithelial cells of high-grade prostatic intraepithelial neoplasia (PIN), and in a majority (60 –100 %) of prostate cancers (CaP) as compared to minimal expression in normal and benign hyperplastic lesions of the prostate HMWCK AMACR CaP Biopsy
Metabolic Effects of AMACR Production of: H2O2 NADH FAS substrates Active - Intermediates
Optimizing With a Cellular Model Transcript; Real Time PCR: LNCaP Vs. NPrEC 12-16 Fold Increase LNCaP Cells 2-4 cell sensitivity Tested on 27 Patient Samples; 15 Healthy 12 CaP
AMACR is not Induced…….. Rather Stabilized by Its Substrate NPREC Westerns Quantitative PCR LNCaP
Treatment with Substrate…..2D Plots LC/MS Cells Expressing AMACR Vs. Cells that do not! Above (LCMS ion plots from 3x3 treated vs non treated LNCaP and Du145 cell lines): Overall these ion plots illustrate the first step in overall consistency between runs, with minor adjustment to RT alignment required.
Treatment with Substrate…..2D Plots LC/MS Comparative Analysis and Protein ID’s? Above (LCMS/MS spectra from a single binned averaged representation of all runs with peptides sequence attached. Following RT alignment and binning (clustering all runs into single bins by time and mass) by Refiner MS by Genedata, statistical analysis can be carried out in Analyst by Genedata.
Statistical Outcome: The plots on the left indicate the relative differences in abundance of the top 25 ions between treated and non-treated LNCaP cells, with a heat map of the same ions just to the upper right, and a PCA plot illustrating complete separation of these two groups
Proteins Specific to Treatment (LNCaP): dihydrolipoamide dehydrogenase, H2B histone, RAS oncogene family, annexin A5, citrate synthase, karyopherin (importin), phosphatidylethanolamine binding protein 1, APEX nuclease (multifunctional DNA repair enzyme), lactate dehydrogenase B, non-metastatic cells (NM23A & NM23B), glycyl-tRNA synthetase, adenine phosphoribosyltransferase, Rho GDP dissociation inhibitor (GDI), aldehyde dehydrogenase, aldolase, fructose-bisphosphate, nucleolin, cathepsin B
Proteins Specific to Treatment Du145: enolase alpha, non-metastatic cells (NM23B),eukaryotic translation elongation factor 1, ubiquinol-cytochrome c reductase, Rieske iron-sulfur polypeptide 1, SMT3 suppressor of mif, enoyl Coenzyme A hydratase, peptidylprolyl isomerase A, proteasome (macropain), tropomyosin 4, histone H2, integrin beta, thioredoxin reductase, vinculin, enolase (alpha), protein disulfide isomerase, nicotinamide N-methyltransferase, profilin 1, eukaryotic translation elongation factor, tyrosine 3/5-monooxygenase
Identification of Markers from Gentamicin Induced Kidney Damage in Monkey…….
Overview of Approach From Similar Study on Rat Meistermann, et. al. MCP 2006
Identification of Toxic Markers Via Mass Profiling (Monitored by MALDI-Tof MS)
Control Treated Expansion of Region of Interest Relative Intensity (%) m/z
12898.9 Da 10000 0 20000 m/z 1st Dimension Separation by RF-HPLC (Top-Down Approach – Monitored by MALDI-Tof MS) • Tissue Preparation: • 288 mg tissue, minced by hand with razor at 4°C • Homogenized in Kontes Duvall in 500 ml of homogenization medium • HB(25% sucrose, TRIS HCL10 mM pH 7.5, 500 mM PMSF) • Transferred to 1.5 ml eppendorf vial and wash 3x with 50mcl HB • Centrifuged at 4°C 680g 10 min, (looked a bit thick – more HB added up to 850 ml and centrifuged again) • Super transferred to a 1.5 ml eppendorf vial, note that nuclear pellet contained some traces of the protein of interest but at levels considerably lower than that of the cytosol. • Centrifuged for 1 hour at maximal (i.e. 16,000 g), pellet discarded MALDI Spectrum from fraction 43 Fraction 43 Relative Intensity (%) absorbance Time (minutes) *- All ID work including HPLC fractionation was carried out on the cytosolic fraction
2nd Dimension Separation Strategy on F43 Following LCMALDI-MS (Negative Cu-Stained 1D PAGE) standards blank sample (x µg) pre-cut sample Albumin (66.4 kDa) Post-RF HPLC Impurities Apomyoglobin (16.9 kDa) 100-200ng (~12.7 kDa) Cytochrome C (12.4 kDa) ng protein/ lane gel slices 5 0 87 22 350 1400 1) The proteins are either electroeluted or in-gel digested followed by Tof/Tof based characterization!
Characterization of Unknown Protein by LC-MS(MS)2 60 min RF-LC Run on Tryptic Peptides
Performed in-gel digestion of excised gel band using trypsin Characterized tryptic fragments by LC-MSMS on the LCQ-Deca+plus and by MALDI-TOF/TOF MASHRLLLLC LAGLVFVSEA GPTGVDESKC PLMVKVLDAV RGSPAVNVAV NVFKKAADET WAPFASGKTS ESGELHGLTT EEEFVEGIYKVEIDTKSYWK SLGISPFHEH AEVVFTANDSGPRHYTIARLLSPYSYSTTAVVTNPKE Protein ID: gi|23574795|dbj|BAC20609.1| transthyretin [Macaca fascicularis] Avg Mass: 15916.1 Coverage: 65/147 = 44.2% by amino acid count, 7103.9/15916.1 = 44.6% by mass *Designates coverage by Applied Biosystems 4700 Tof-Tof analysis as well.
Finding the Correct form of the Protein Can be a Challenge Macaca TTR, 15918Da, 13792Da, mashrllllclaglvfvsea/ gptgtgeskc/(cleavage sites?) 1 plmvkvldavrgspainvavhvfrkaaddtwepfasgktsesgelhgltteeefvegiyk 61 veidtksywkalgispfhehaevvftandsgprrytiaallspysysttavvtnpke 127 AA, active form, 21-147, 13763 Da gptgtgeskcplmvkvldavrgspainvavhvfrkaaddtwepfasgktsesgelhgltteeefvegiykveidtksywkalgispfhehaevvftandsgprrytiaallspysysttavvtnpke Extrahepatic sequence?, 31-147, 12845 Da plmvkvldavrgspainvavhvfrkaaddtwepfasgktsesgelhgltteeefvegiykveidtksywkalgispfhehaevvftandsgprrytiaallspysysttavvtnpke Pro-form, 147 AA, 15887 Da mashrllllclaglvfvseagptgtgeskcplmvkvldavrgspainvavhvfrkaaddtwepfasgktsesgelhgltteeefvegiykveidtksywkalgispfhehaevvftandsgprrytiaallspysysttavvtnpke 11810.7 Da with potential cleavage at site aa: gptgtgeskcplmvkvldavrgspainvavhvfrkaaddtwepfasgktsesgelhgltteeefvegiykveidtksywkalgispfhehaevvftandsgprrytia
MW Standards Cytosolic Fraction* 36 22 16 6 ~12-14 kDa Initial Confirmation by Western Analysis (Rabbit anti-TTR 1opAb (Novocastra Labs), Donkey anti-rabbit HRP 2oAb) Gel: • Ran 4-12% Tris-Glycine gel at 150V with 50ml of • cytosol sample (10 ml cytosol in 20ml LDS buffer, 15 ml H2O, • 5 ml Reducing agent) approx. 1 hr. Sample was first heated on • thermocycler for 10 min. at 70°C. Loaded 14 ml (50 mg) and • 7 ml (25 mg) of sample in duplicate along w/ 10 ml • See Blue STD. • Running Buffer (950 ml H2O, 50 ml MOPS SDS 20X • NuPage running buffer). Electroblotting w/BioRad Trans-Blot SD cell: • Transfer Buffer (5.82g Tris, 2.93 g Glycine, 0.0377g • SDS, 200ml MeOH, 800 ml H2O) • Wetted Imobilon –psq Millipore membranes with MeOH • then TB. • Assembled Trans-blot apparatus and ran for 30 min. @ • 15V. • Placed gel in H2O, then PBS/Tween (500 ml Dulbecco’s • PBS, 0.05 ml Tween 20). Introduction of Antibodies: • Added Blocking Agent (2.5g BA from kit, 50 ml PBST), • left on lab rotator for 1 hr @ RT, then washed 3X for 15min. w/PBST • Diluted 1° Ab in 1 ml H2O. Diluted further @ 1:1000(50 ml Ab, 50 ml PBST) • Added 1° Ab to membrane and rotated @ 4°C for 2 hrs., washed 2X quickly in PBST, 3X for 15 min. • Added 2° Ab @ 1:5000 (10 ml Ab, 50 ml PBST), rotated for 1 hr @ RT, washed 2X quickly, 3X for 15 min. in PBST. • Using BCA reagents from Amersham ECL kit, combined 2 ml soln. A with 50 ml of soln. B. Pipetted over membrane for • approx. 5 min. in dark. Used Typhoon Imager with blue laser to image membrane and TTR band. *- Single band shown in MW range of interest, non-specific bands present above 50kDa
TTR (Control Kidney) TTR (Treated Kidney) IP-MALDI-MS for TTR Mass Difference (1,221 Dalton) 12,220 Da 13,756 Da
Initial Confirmation by Western Analysis (Rabbit anti-TTR 1opAb (Novocastra Labs), Donkey anti-rabbit HRP 2oAb) Urine Specimens Control/ Treated Truncated Protein Specific to Disease