Understanding Parameters and Statistics in Voter Registration and Traffic Studies
100 likes | 218 Vues
This document explores the concepts of parameters and statistics through real-world examples including voter registration data in Indianapolis and WAIS IQ scores. It discusses a study of random phone dialings revealing that 73% of contacted voters are registered Republicans, compared to a population parameter of 68%. It also examines WAIS scores and their normal distribution, calculating probabilities related to scores and nitrogen oxide emissions in specific vehicles. Additionally, it addresses the Central Limit Theorem, sampling distributions, and practical applications in traffic studies.

Understanding Parameters and Statistics in Voter Registration and Traffic Studies
E N D
Presentation Transcript
Identify which is a parameter and which is a statistic. Voter registration records show that 68% of all voters in Indianapolis are registered as Republicans. To Test whether the numbers dialed by a random digit dialing device really are random, you use the device to call 150 randomly chosen telephones in Indianapolis. Of the registered voters contacted, 73% are registered republicans
Voter registration records show that 68% of all voters in Indianapolis are registered as Republicans. To Test whether the numbers dialed by a random digit dialing device really are random, you use the device to call 150 randomly chosen telephones in Indianapolis. Of the registered voters contacted, 73% are registered republicans. • What are the mean and standard deviation of the sample proportion of registered republicans in samples of size 150 from Indianapolis? • Find the probability of obtaining an SRS of size 150 from the population of Indianapolis voters in which 73% or more are registered Republicans.
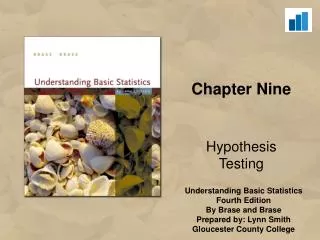
The WAIS test is a common IQ test for adults. The distribution of WAIS scores for persons over 16 years of age is approximately normal with mean 100 and standard deviation of 15. • What is the probability that a randomly chosen individual has a WAIS score of 105 or higher? • What are the mean and standard deviation of the sampling distribution of the average WAIS score (xbar) for an SRS of 60 people. • What is the probability that the average WAIS score of an SRS of 60 people is 105 or higher?
The level of nitrogen oxides (NOX) in the exhaust of cars of a particular model varies normally with a mean .2 grams per mile and standard deviation .05 grams per mile. Governments regulations call for NOX emissions to be no higher than .3 g/mi. • What is the probability that a single car of this model fails to meet the NOX requirement? • A company has 25 cars of this model in its fleet. What is the probability that the average NOX level (xbar) of these cars is above the .3 g/mi. limit?
What does rule of thumb 1 state? When is it used? What does rule of thumb 2 state? When is it used?
What is the central limit theorem state? When do you use it?
What is the notation used for the following and what is the formula for finding: • Sampling proportion mean • Sampling proportion standard deviation • Sample mean mean • Sample mean standard deviation
A study of rush hour traffic in San Francisco counts the number of people in each car entering the freeway at a suburban interchange. Suppose that this count has a mean 1.5 and standard deviation .75 in the population of all cars that enter at this interchange during rush hours. • Traffic engineers estimate that the capacity of the interchange is 700 cars per hours. According to the Central Limit Theorem, what is the approximate distribution of the mean number of persons (xbar) in 700 randomly selected cars at this interchange. • What is the probability that 700 cars will carry more than 1075 people?